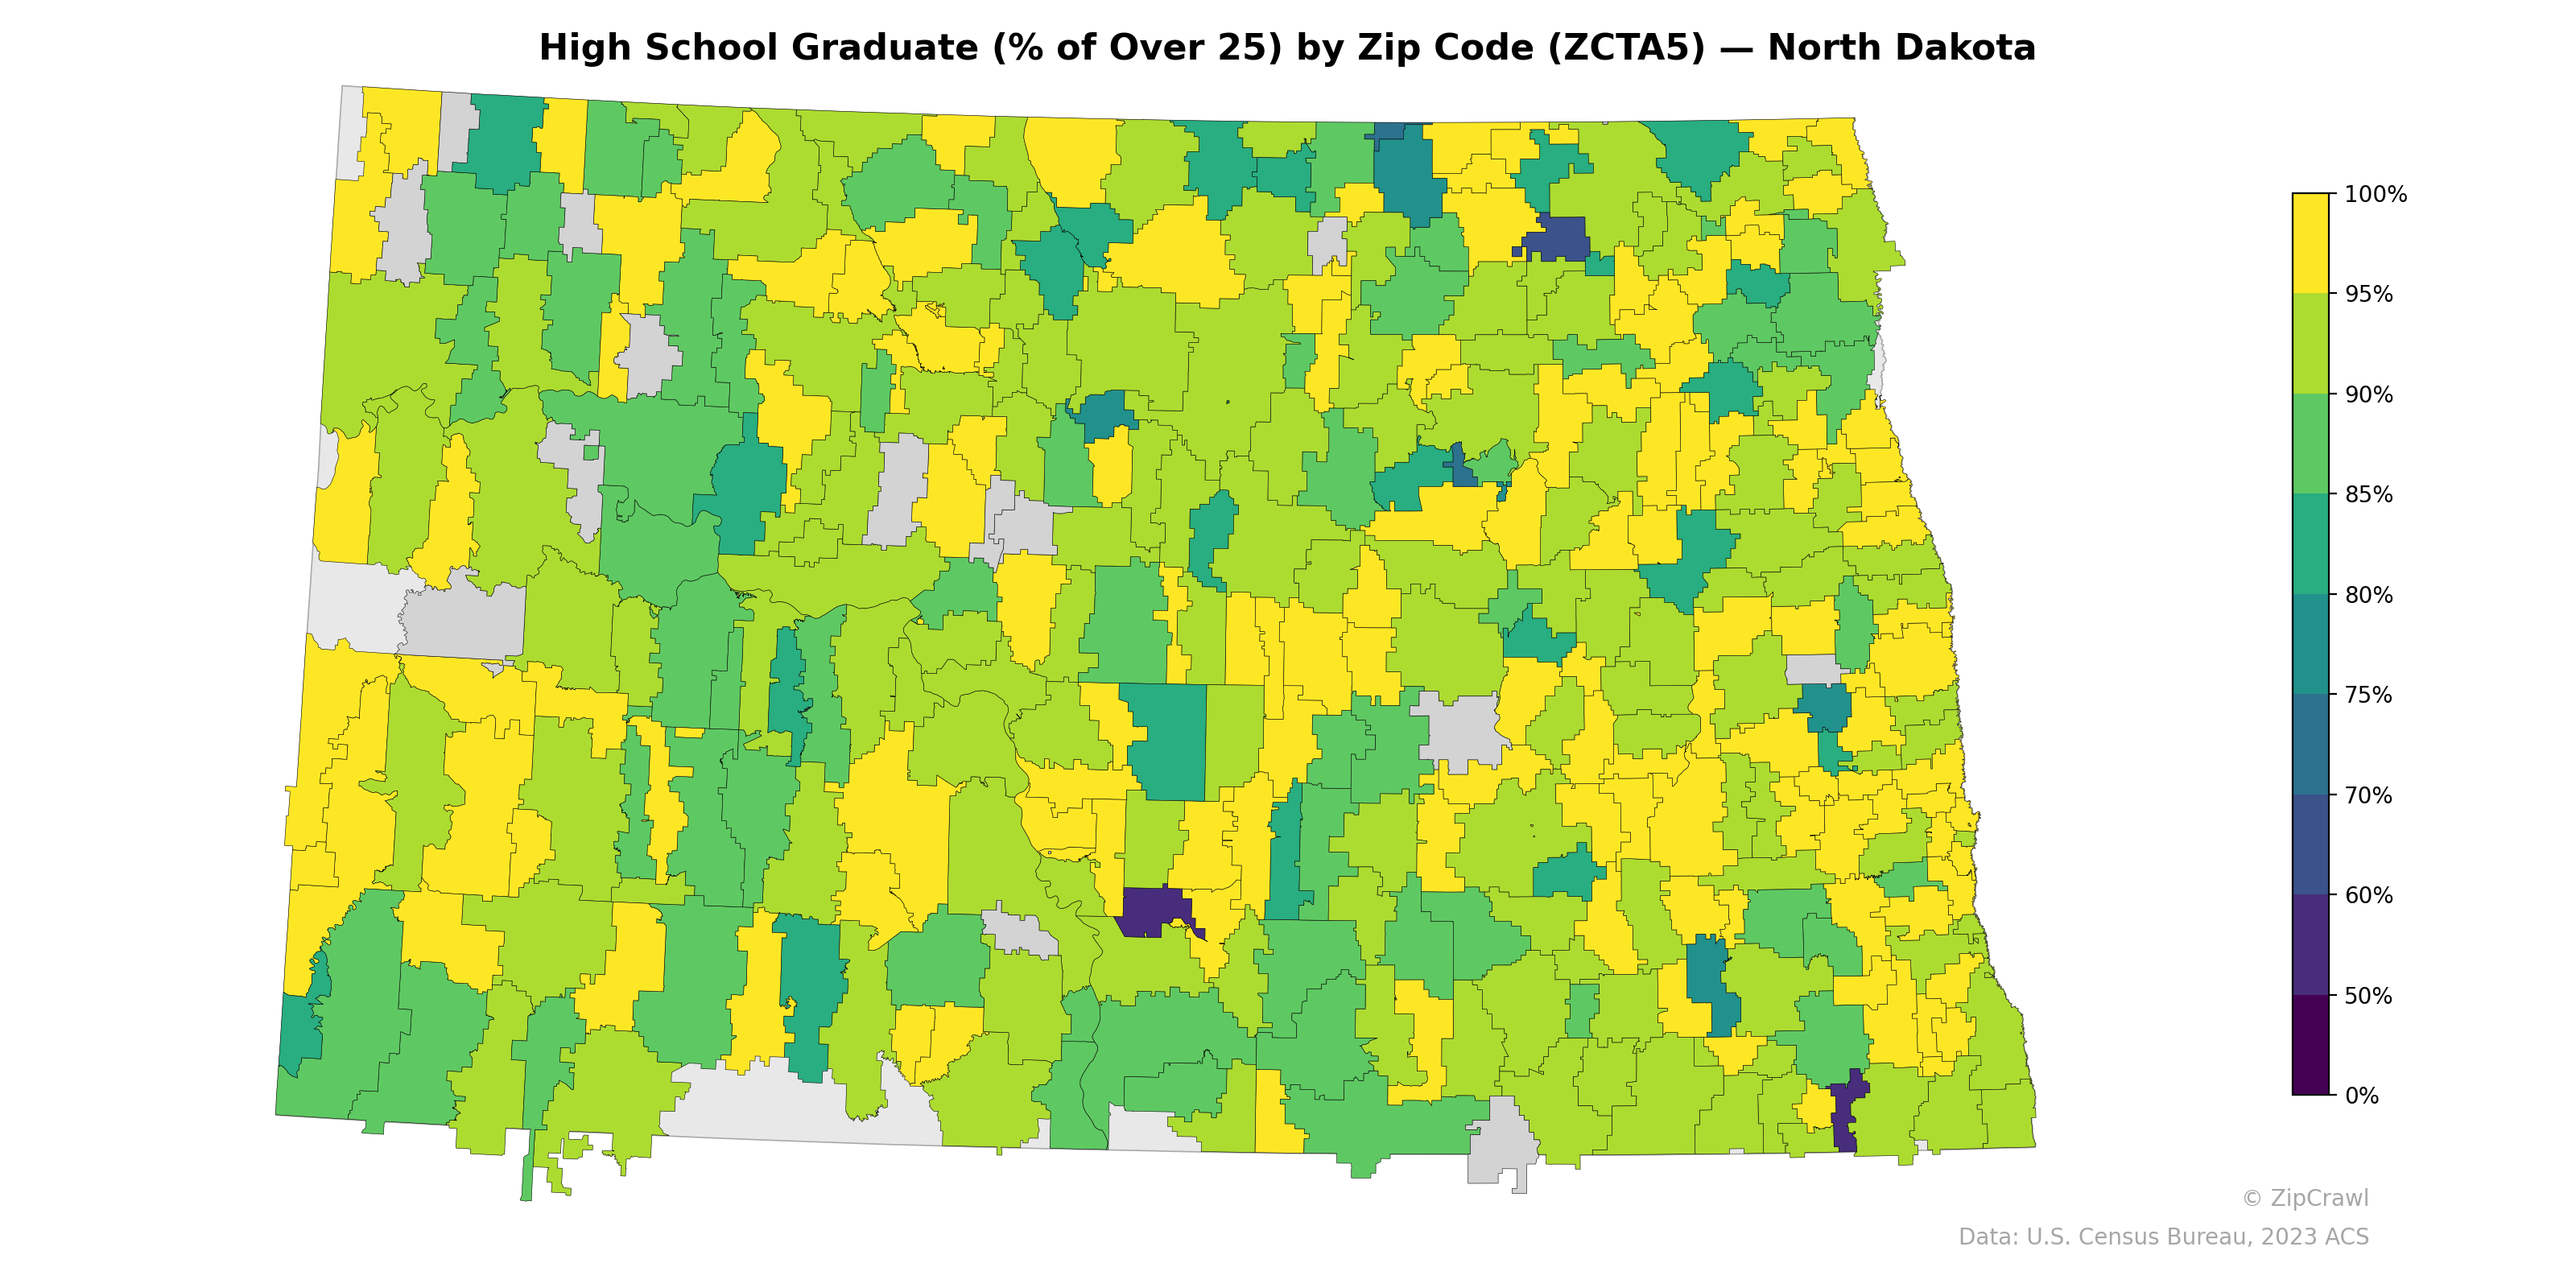
NOTE: Gray indicates insufficient data or a suppressed estimate.
Most North Dakota zip codes exhibit high school graduation rates above 85%, with widespread yellow and yellow-green shading indicating rates in the 90–100% range across much of the western and central portions of the state. Notable exceptions include a cluster of very low graduation rates (below 50%) in the south-central region and the southeastern corner, likely corresponding to Native American reservation communities such as Standing Rock and the Spirit Lake/Fort Totten area, where socioeconomic disparities persistently affect educational attainment. Gray areas scattered throughout the state, particularly in the northwest, represent zip codes with insufficient data or minimal population, while the urban centers of Fargo, Bismarck, and Grand Forks display moderate variability in the 80–95% range.
Data: U.S. Census Bureau, 2023 ACS
Explore
- Housing % of Units Built Since 2010, by Zip Code (ZCTA5) — New York
- Population Non-Hispanic American Indian % by Zip Code (ZCTA5) — North Dakota
- Housing Median Monthly Rent ($), by Zip Code (ZCTA5) — North Dakota
- Housing Owner-Occupied % of Units, by Zip Code (ZCTA5) — North Dakota
- Bachelor's Degree or Higher (% of Over 25) by Zip Code (ZCTA5) — North Dakota
- Household Average Size by Zip Code (ZCTA5) — North Dakota
- Housing % of Units Built Since 2010, by Zip Code (ZCTA5) — North Dakota
- Housing Owner-Occupied Median Value ($), by Zip Code (ZCTA5) — North Dakota
- % of Households with Broadband Internet, by Zip Code (ZCTA5) — North Dakota
- % of Population without Health Insurance, by Zip Code (ZCTA5) — North Dakota
- Household Average Size by County
- Married Couple (% of all Households) by Zip Code (ZCTA5) — New York
- Household Average Size by Zip Code (ZCTA5) — New York
- % of Population on Food Stamps or SNAP (Last 12 Months), by Zip Code (ZCTA5) — Indiana
- Housing Owner-Occupied % of Units, by Zip Code (ZCTA5) — New York
- % of Households with Broadband Internet, by Zip Code (ZCTA5) — New York
- Housing Owner-Occupied Median Value ($), by Zip Code (ZCTA5) — New York
- Housing Vacancy Rate by Zip Code (ZCTA5) — New York
- % of Population on Food Stamps or SNAP (Last 12 Months), by Zip Code (ZCTA5) — New York
- Bachelor's Degree or Higher (% of Over 25) by Zip Code (ZCTA5) — New York
- Housing Median Monthly Rent ($), by Zip Code (ZCTA5) — New York
- % of Population without Health Insurance, by Zip Code (ZCTA5) — New York
- Housing Vacancy Rate by Zip Code (ZCTA5) — Alaska
- Population Non-Hispanic Black % by Zip Code (ZCTA5) — North Dakota
- Married Couple (% of all Households) by Zip Code (ZCTA5) — Rhode Island
- Population Non-Hispanic American Indian % by Zip Code (ZCTA5) — Rhode Island
- Housing % of Units Built Since 2010, by Zip Code (ZCTA5) — Rhode Island
- Median Age by Zip Code (ZCTA5) — Oregon
- Household Average Size by Zip Code (ZCTA5) — Rhode Island
- Housing Vacancy Rate by Zip Code (ZCTA5) — Rhode Island
- High School Graduate (% of Over 25) by Zip Code (ZCTA5) — South Dakota
- High School Graduate (% of Over 25) by Zip Code (ZCTA5) — North Carolina
- High School Graduate (% of Over 25) by Zip Code (ZCTA5) — Ohio
- High School Graduate (% of Over 25) by Zip Code (ZCTA5) — Nevada
- High School Graduate (% of Over 25) by Zip Code (ZCTA5) — Utah
- High School Graduate (% of Over 25) by Zip Code (ZCTA5) — Iowa
- High School Graduate (% of Over 25) by Zip Code (ZCTA5) — Minnesota
- High School Graduate (% of Over 25) by Zip Code (ZCTA5) — Colorado
- High School Graduate (% of Over 25) by Zip Code (ZCTA5) — Texas
- High School Graduate (% of Over 25) by Zip Code (ZCTA5) — Oregon