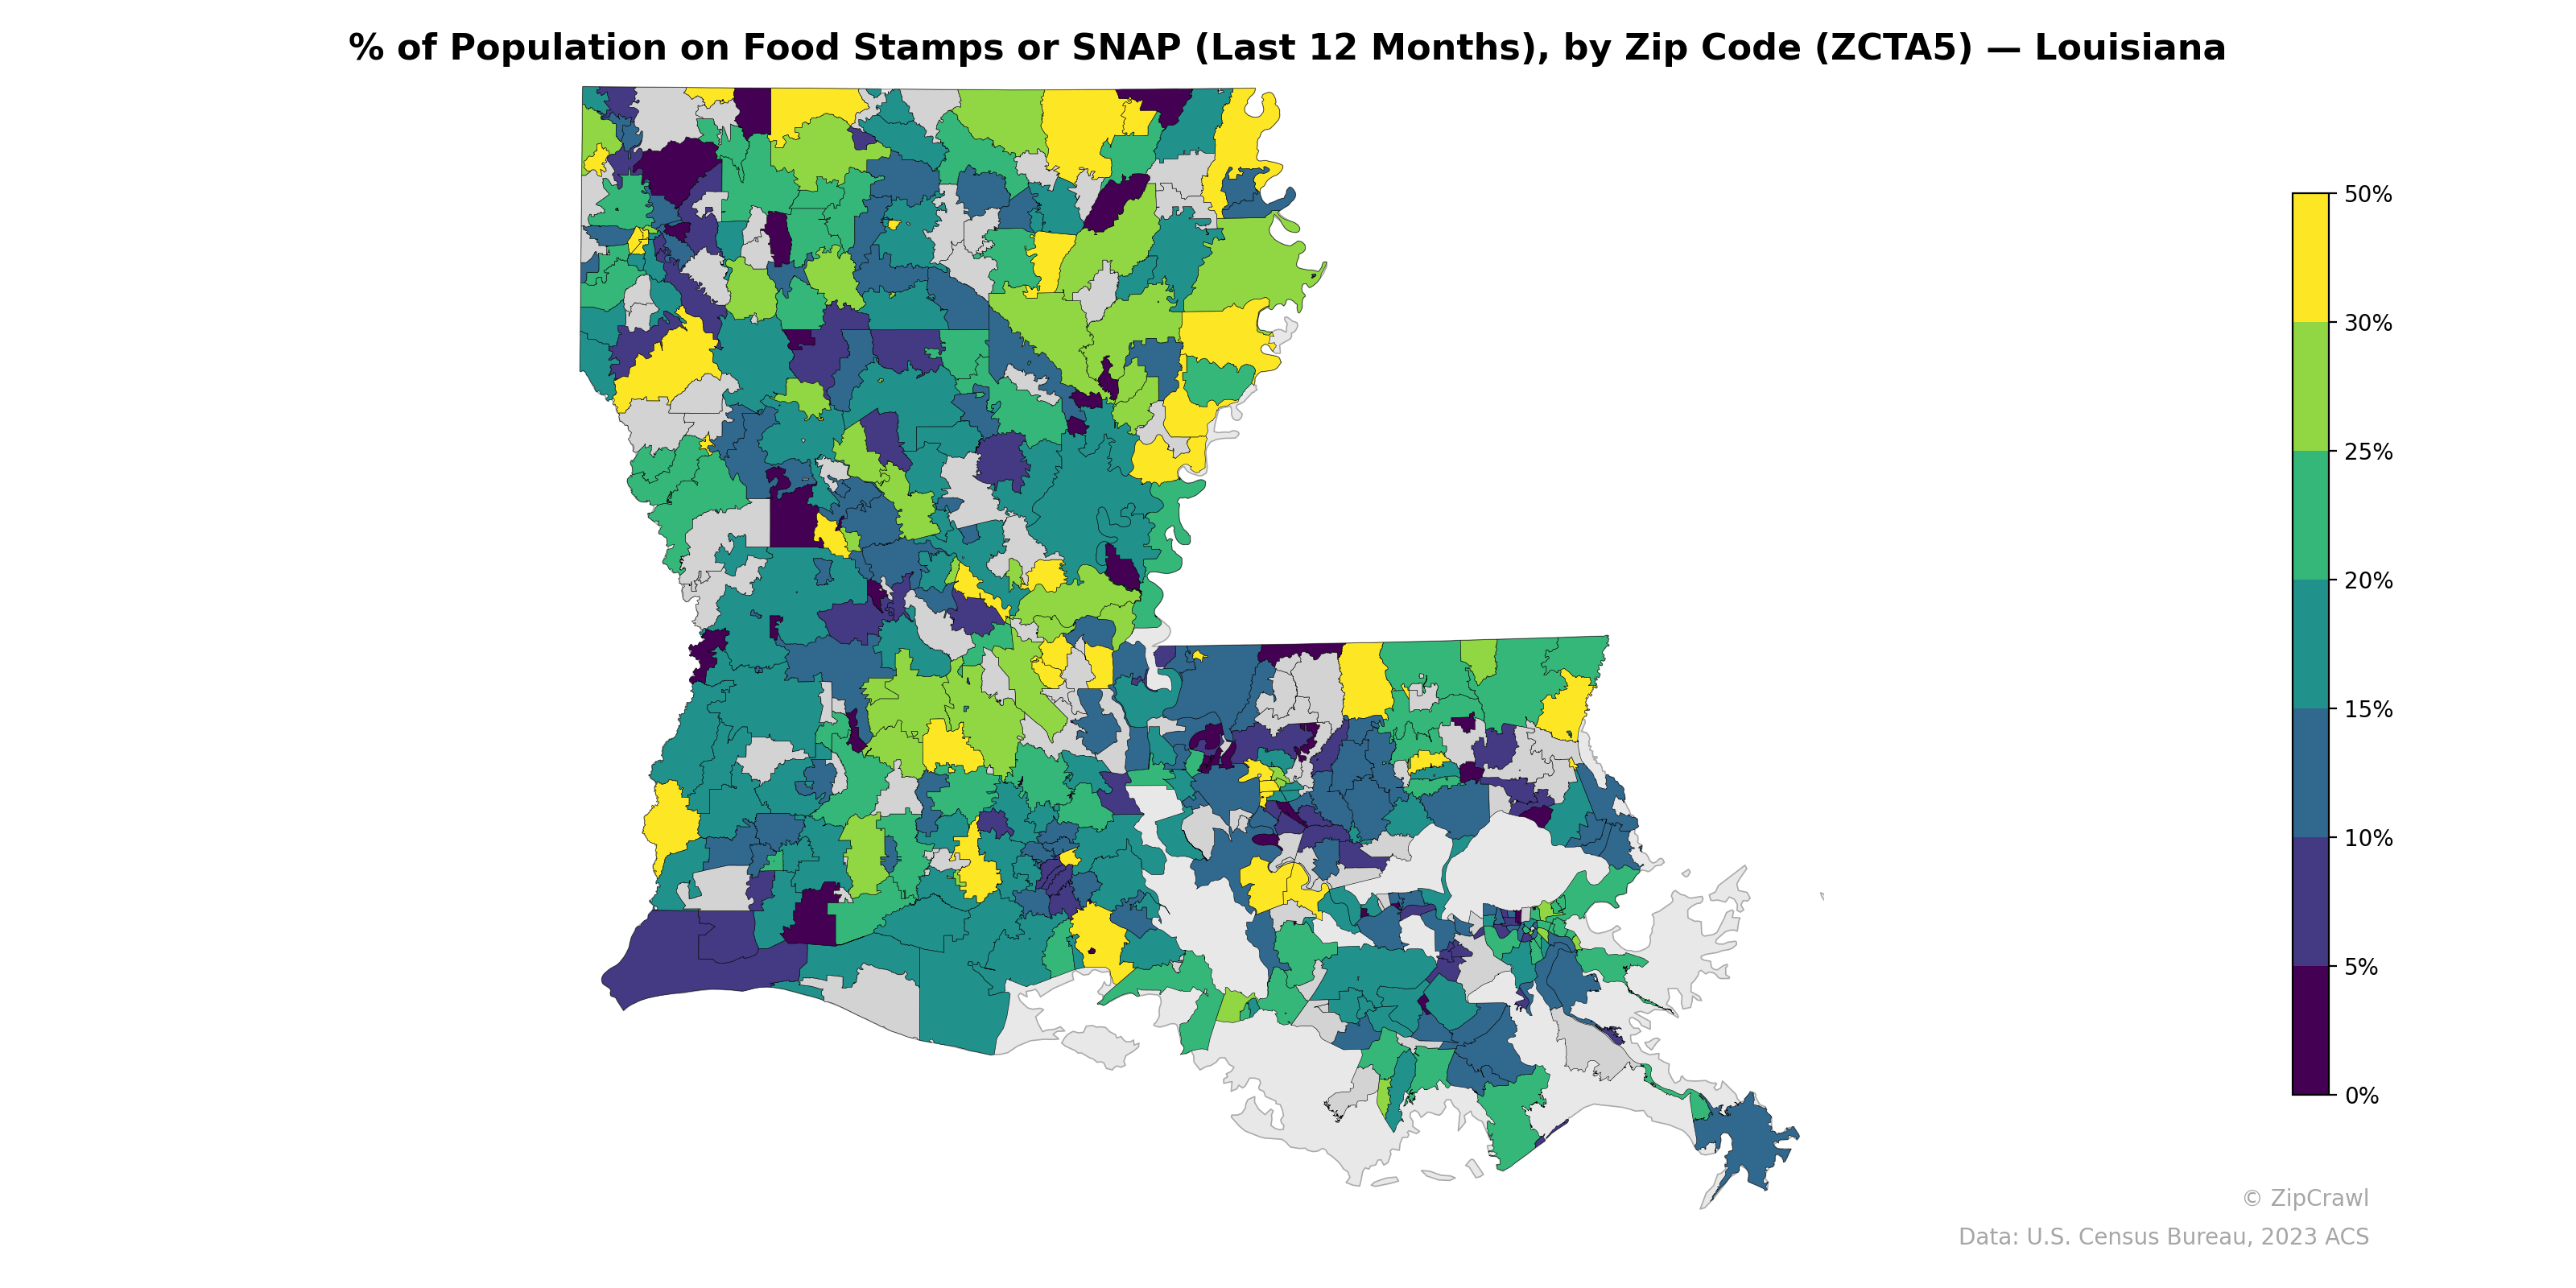
NOTE: Gray indicates insufficient data or a suppressed estimate.
Northern Louisiana, particularly the Mississippi Delta region along the northeastern border, exhibits consistently elevated SNAP participation rates, with numerous zip codes reaching 35–50%, reflecting the persistent poverty concentrated in that corridor. The southern coastal and suburban areas surrounding Baton Rouge and the Northshore of Lake Pontchartrain display markedly lower rates, generally below 10–15%, creating a stark north-south gradient across the state. Pockets of high SNAP usage also appear in urban cores such as Shreveport, Monroe, and parts of New Orleans, contrasting sharply with adjacent suburban zip codes that register significantly lower participation.
Data: U.S. Census Bureau, 2023 ACS
Explore
- Household Median Income by Zip Code (ZCTA5) — California
- U.S. Citizens (% of Population Over 18) by Zip Code (ZCTA5) — Kentucky
- Population Non-Hispanic Black % by Zip Code (ZCTA5) — Kentucky
- Married Couple (% of all Households) by Zip Code (ZCTA5) — Louisiana
- Median Age by Zip Code (ZCTA5) — Kentucky
- Household Median Income by Zip Code (ZCTA5) — Kentucky
- Population Hispanic % by Zip Code (ZCTA5) — Kentucky
- Population Non-Hispanic Asian % by Zip Code (ZCTA5) — Louisiana
- Housing Vacancy Rate by Zip Code (ZCTA5) — Louisiana
- Population Non-Hispanic White % by Zip Code (ZCTA5) — Kentucky
- % of Households with Broadband Internet, by County
- Population Hispanic % by Zip Code (ZCTA5) — California
- Population Non-Hispanic American Indian % by Zip Code (ZCTA5) — California
- High School Graduate (% of Over 25) by Zip Code (ZCTA5) — California
- Population Non-Hispanic Black % by Zip Code (ZCTA5) — California
- Population Non-Hispanic Asian % by Zip Code (ZCTA5) — Texas
- Median Age by Zip Code (ZCTA5) — California
- U.S. Citizens (% of Population Over 18) by Zip Code (ZCTA5) — California
- Population Non-Hispanic White % by Zip Code (ZCTA5) — California
- Housing Owner-Occupied % of Units, by Zip Code (ZCTA5) — Florida
- Housing Owner-Occupied Median Value ($), by Zip Code (ZCTA5) — Alabama
- Housing Owner-Occupied % of Units, by Zip Code (ZCTA5) — Alabama
- Housing Median Monthly Rent ($), by Zip Code (ZCTA5) — Alabama
- Housing % of Units Built Since 2010, by Zip Code (ZCTA5) — Alabama
- Household Average Size by Zip Code (ZCTA5) — Alabama
- Housing Vacancy Rate by Zip Code (ZCTA5) — Alabama
- % of Households with Broadband Internet, by Zip Code (ZCTA5) — Alabama
- % of Population without Health Insurance, by Zip Code (ZCTA5) — Alabama
- Married Couple (% of all Households) by Zip Code (ZCTA5) — Alabama
- Population Non-Hispanic American Indian % by Zip Code (ZCTA5) — Alabama
- % of Population on Food Stamps or SNAP (Last 12 Months), by Zip Code (ZCTA5) — Montana
- % of Population on Food Stamps or SNAP (Last 12 Months), by Zip Code (ZCTA5) — St. Louis Metro
- % of Population on Food Stamps or SNAP (Last 12 Months), by Zip Code (ZCTA5) — Indiana
- % of Population on Food Stamps or SNAP (Last 12 Months), by Zip Code (ZCTA5) — Oregon
- % of Population on Food Stamps or SNAP (Last 12 Months), by Zip Code (ZCTA5) — Ohio
- % of Population on Food Stamps or SNAP (Last 12 Months), by Zip Code (ZCTA5) — Utah
- % of Population on Food Stamps or SNAP (Last 12 Months), by Zip Code (ZCTA5) — Iowa
- % of Population on Food Stamps or SNAP (Last 12 Months), by Zip Code (ZCTA5) — Maine
- % of Population on Food Stamps or SNAP (Last 12 Months), by Zip Code (ZCTA5) — Arizona
- % of Population on Food Stamps or SNAP (Last 12 Months), by Zip Code (ZCTA5) — Texas