NOTE: Gray indicates insufficient data or a suppressed estimate.
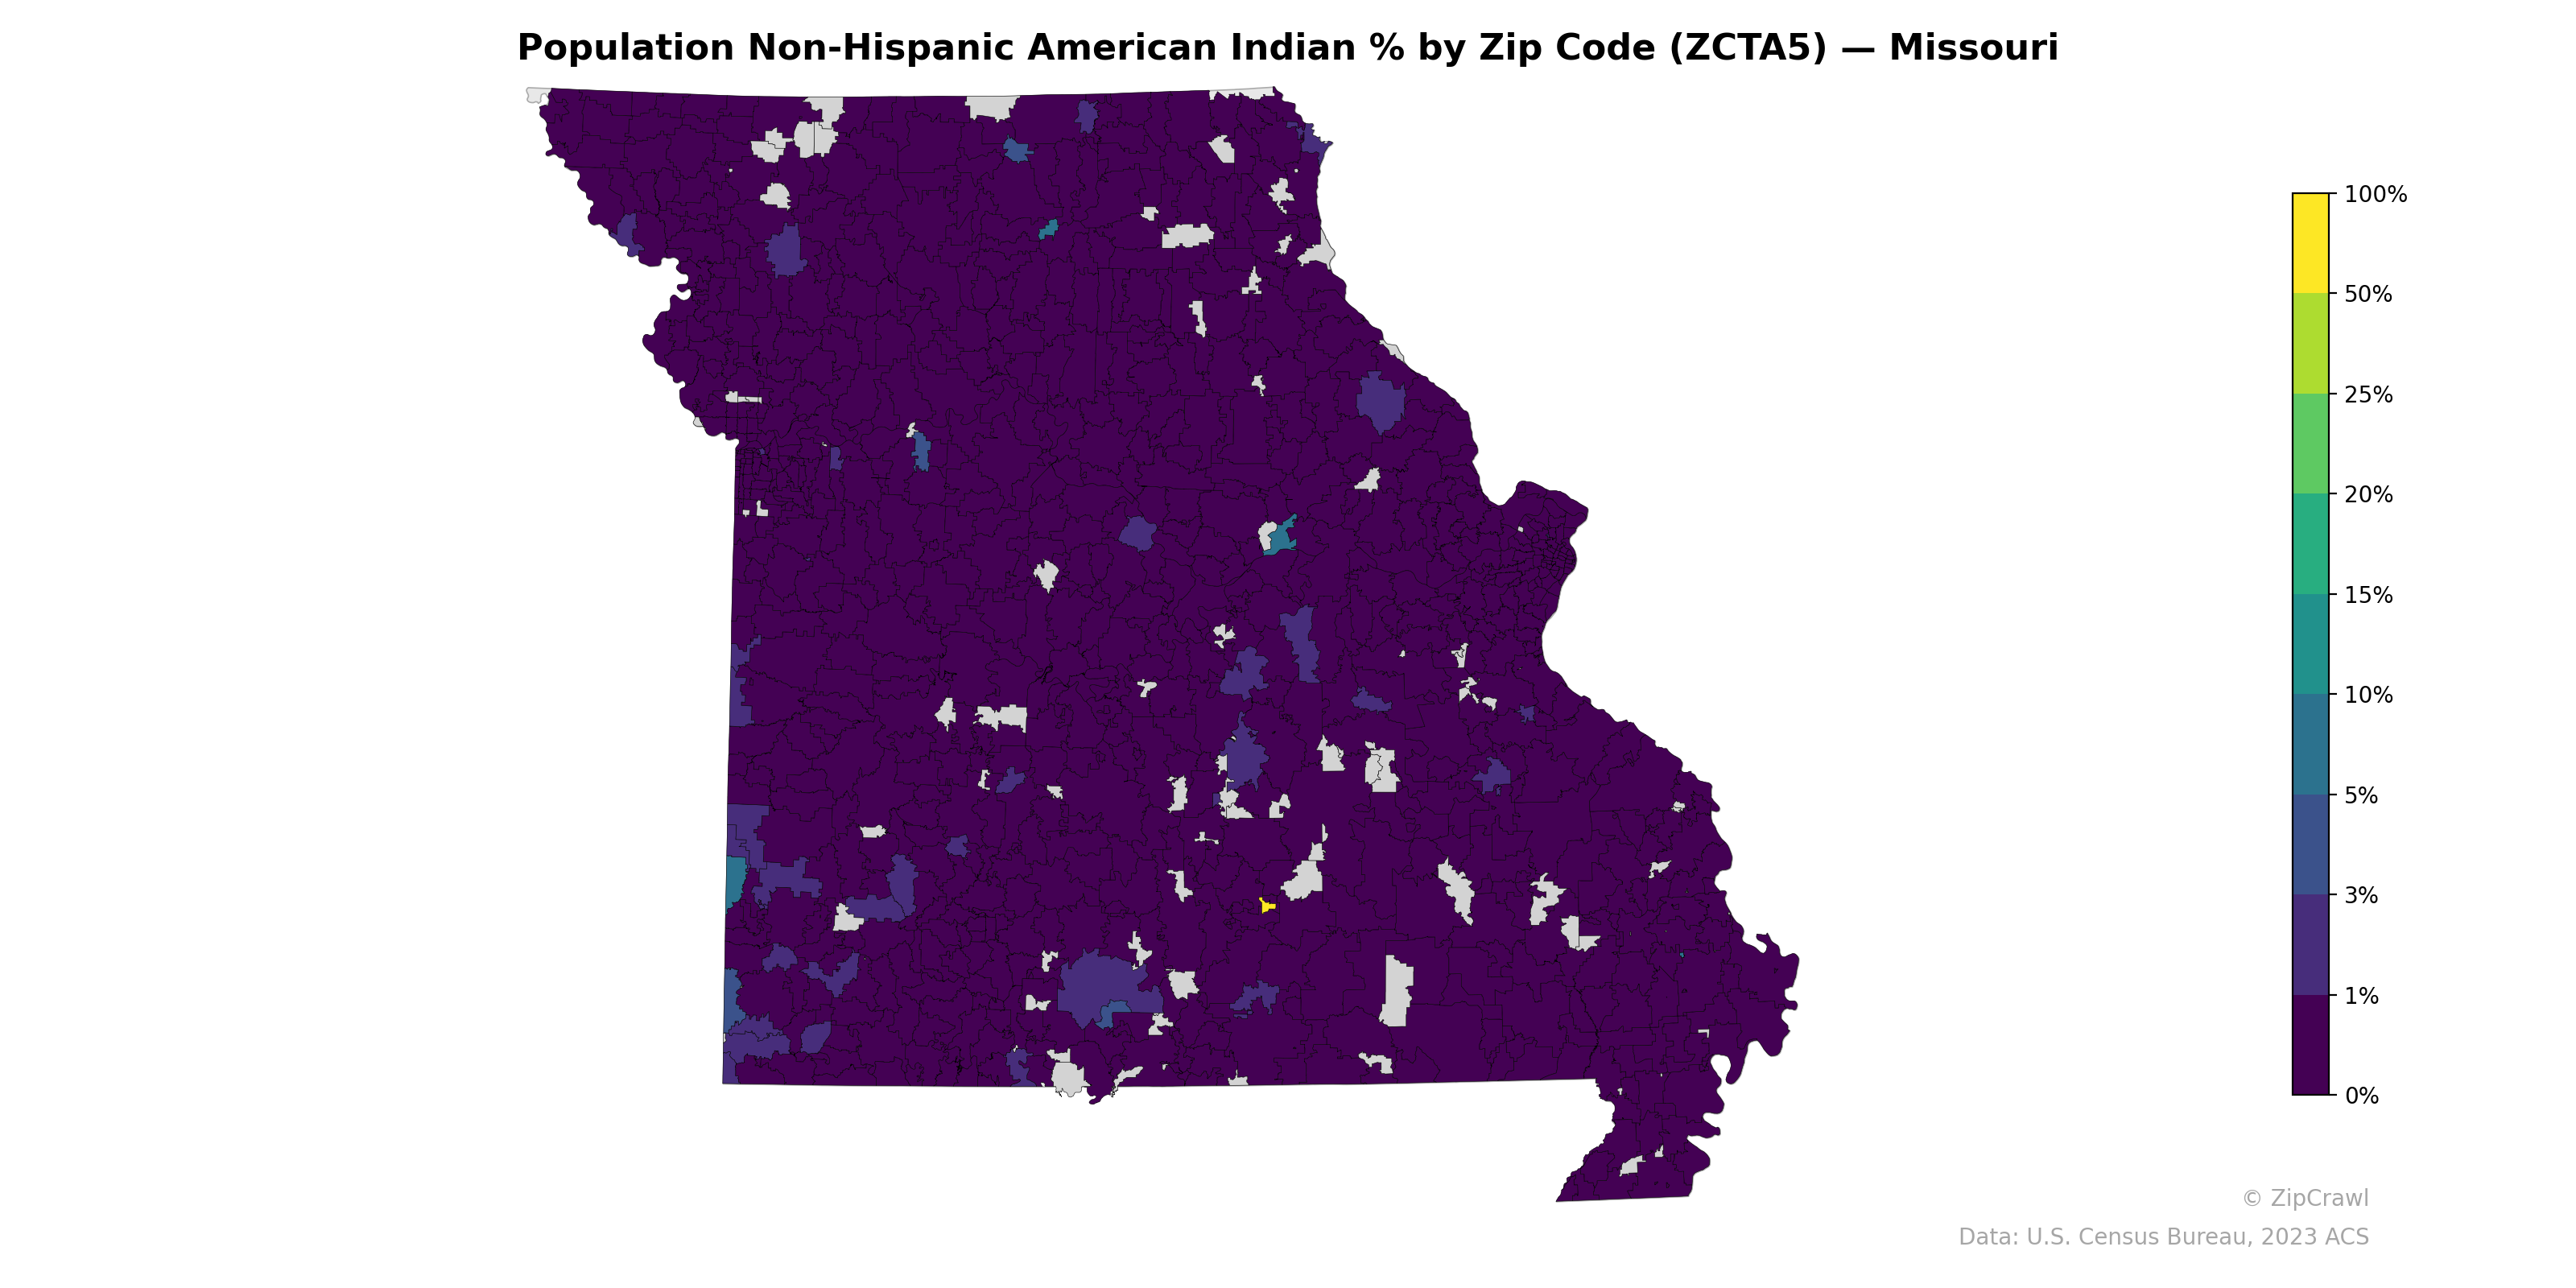
Non-Hispanic American Indian population percentages across Missouri zip codes are uniformly low, with the vast majority of ZCTAs registering below 1%, giving the state a predominantly dark purple appearance. A small cluster of slightly elevated percentages (roughly 1–5%) appears in the southwestern corner of the state near the Oklahoma border, consistent with proximity to tribal nations in northeastern Oklahoma. Scattered zip codes in central Missouri and near the Kansas City metropolitan area show marginally higher concentrations, though no ZCTA approaches double-digit percentages, and one small area in the south-central region displays a notable yellow dot suggesting a localized outlier potentially driven by a very small total population.
Data: U.S. Census Bureau, 2023 ACS
Explore
- Housing % of Units Built Since 2010, by Zip Code (ZCTA5) — Los Angeles Metro
- Population Non-Hispanic White % by Zip Code (ZCTA5) — Missouri
- Population Non-Hispanic Black % by Zip Code (ZCTA5) — Missouri
- Median Age by Zip Code (ZCTA5) — Missouri
- Population Hispanic % by Zip Code (ZCTA5) — Missouri
- Household Median Income by Zip Code (ZCTA5) — Missouri
- Population Non-Hispanic Asian % by Zip Code (ZCTA5) — Indiana
- % of Population on Food Stamps or SNAP (Last 12 Months), by Zip Code (ZCTA5) — Indiana
- High School Graduate (% of Over 25) by Zip Code (ZCTA5) — Missouri
- U.S. Citizens (% of Population Over 18) by Zip Code (ZCTA5) — Missouri
- Housing % of Units Built Since 2010, by Zip Code (ZCTA5) — North Dakota
- Population Non-Hispanic Black % by County
- Housing Vacancy Rate by Zip Code (ZCTA5) — Los Angeles Metro
- Married Couple (% of all Households) by Zip Code (ZCTA5) — Los Angeles Metro
- Household Average Size by Zip Code (ZCTA5) — Los Angeles Metro
- Housing Owner-Occupied % of Units, by Zip Code (ZCTA5) — Los Angeles Metro
- % of Population without Health Insurance, by Zip Code (ZCTA5) — Los Angeles Metro
- Housing Owner-Occupied Median Value ($), by Zip Code (ZCTA5) — Los Angeles Metro
- Bachelor's Degree or Higher (% of Over 25) by Zip Code (ZCTA5) — Los Angeles Metro
- % of Households with Broadband Internet, by Zip Code (ZCTA5) — Los Angeles Metro
- Housing Median Monthly Rent ($), by Zip Code (ZCTA5) — Los Angeles Metro
- Housing Median Monthly Rent ($), by Zip Code (ZCTA5) — Tennessee
- Housing Owner-Occupied % of Units, by Zip Code (ZCTA5) — Tennessee
- Housing % of Units Built Since 2010, by Zip Code (ZCTA5) — Tennessee
- Population Non-Hispanic Black % by Zip Code (ZCTA5) — Tennessee
- Population Hispanic % by Zip Code (ZCTA5) — Tennessee
- % of Households with Broadband Internet, by Zip Code (ZCTA5) — Tennessee
- % of Population without Health Insurance, by Zip Code (ZCTA5) — Tennessee
- Housing Owner-Occupied Median Value ($), by Zip Code (ZCTA5) — Tennessee
- High School Graduate (% of Over 25) by Zip Code (ZCTA5) — Tennessee
- Population Non-Hispanic American Indian % by Zip Code (ZCTA5) — Mississippi
- Population Non-Hispanic American Indian % by Zip Code (ZCTA5) — Indiana
- Population Non-Hispanic American Indian % by Zip Code (ZCTA5) — Michigan
- Population Non-Hispanic American Indian % by Zip Code (ZCTA5) — Maine
- Population Non-Hispanic American Indian % by Zip Code (ZCTA5) — Iowa
- Population Non-Hispanic American Indian % by Zip Code (ZCTA5) — Utah
- Population Non-Hispanic American Indian % by Zip Code (ZCTA5) — Idaho
- Population Non-Hispanic American Indian % by Zip Code (ZCTA5) — Ohio
- Population Non-Hispanic American Indian % by Zip Code (ZCTA5) — Minnesota
- Population Non-Hispanic American Indian % by Zip Code (ZCTA5) — Montana