NOTE: Gray indicates insufficient data or a suppressed estimate.
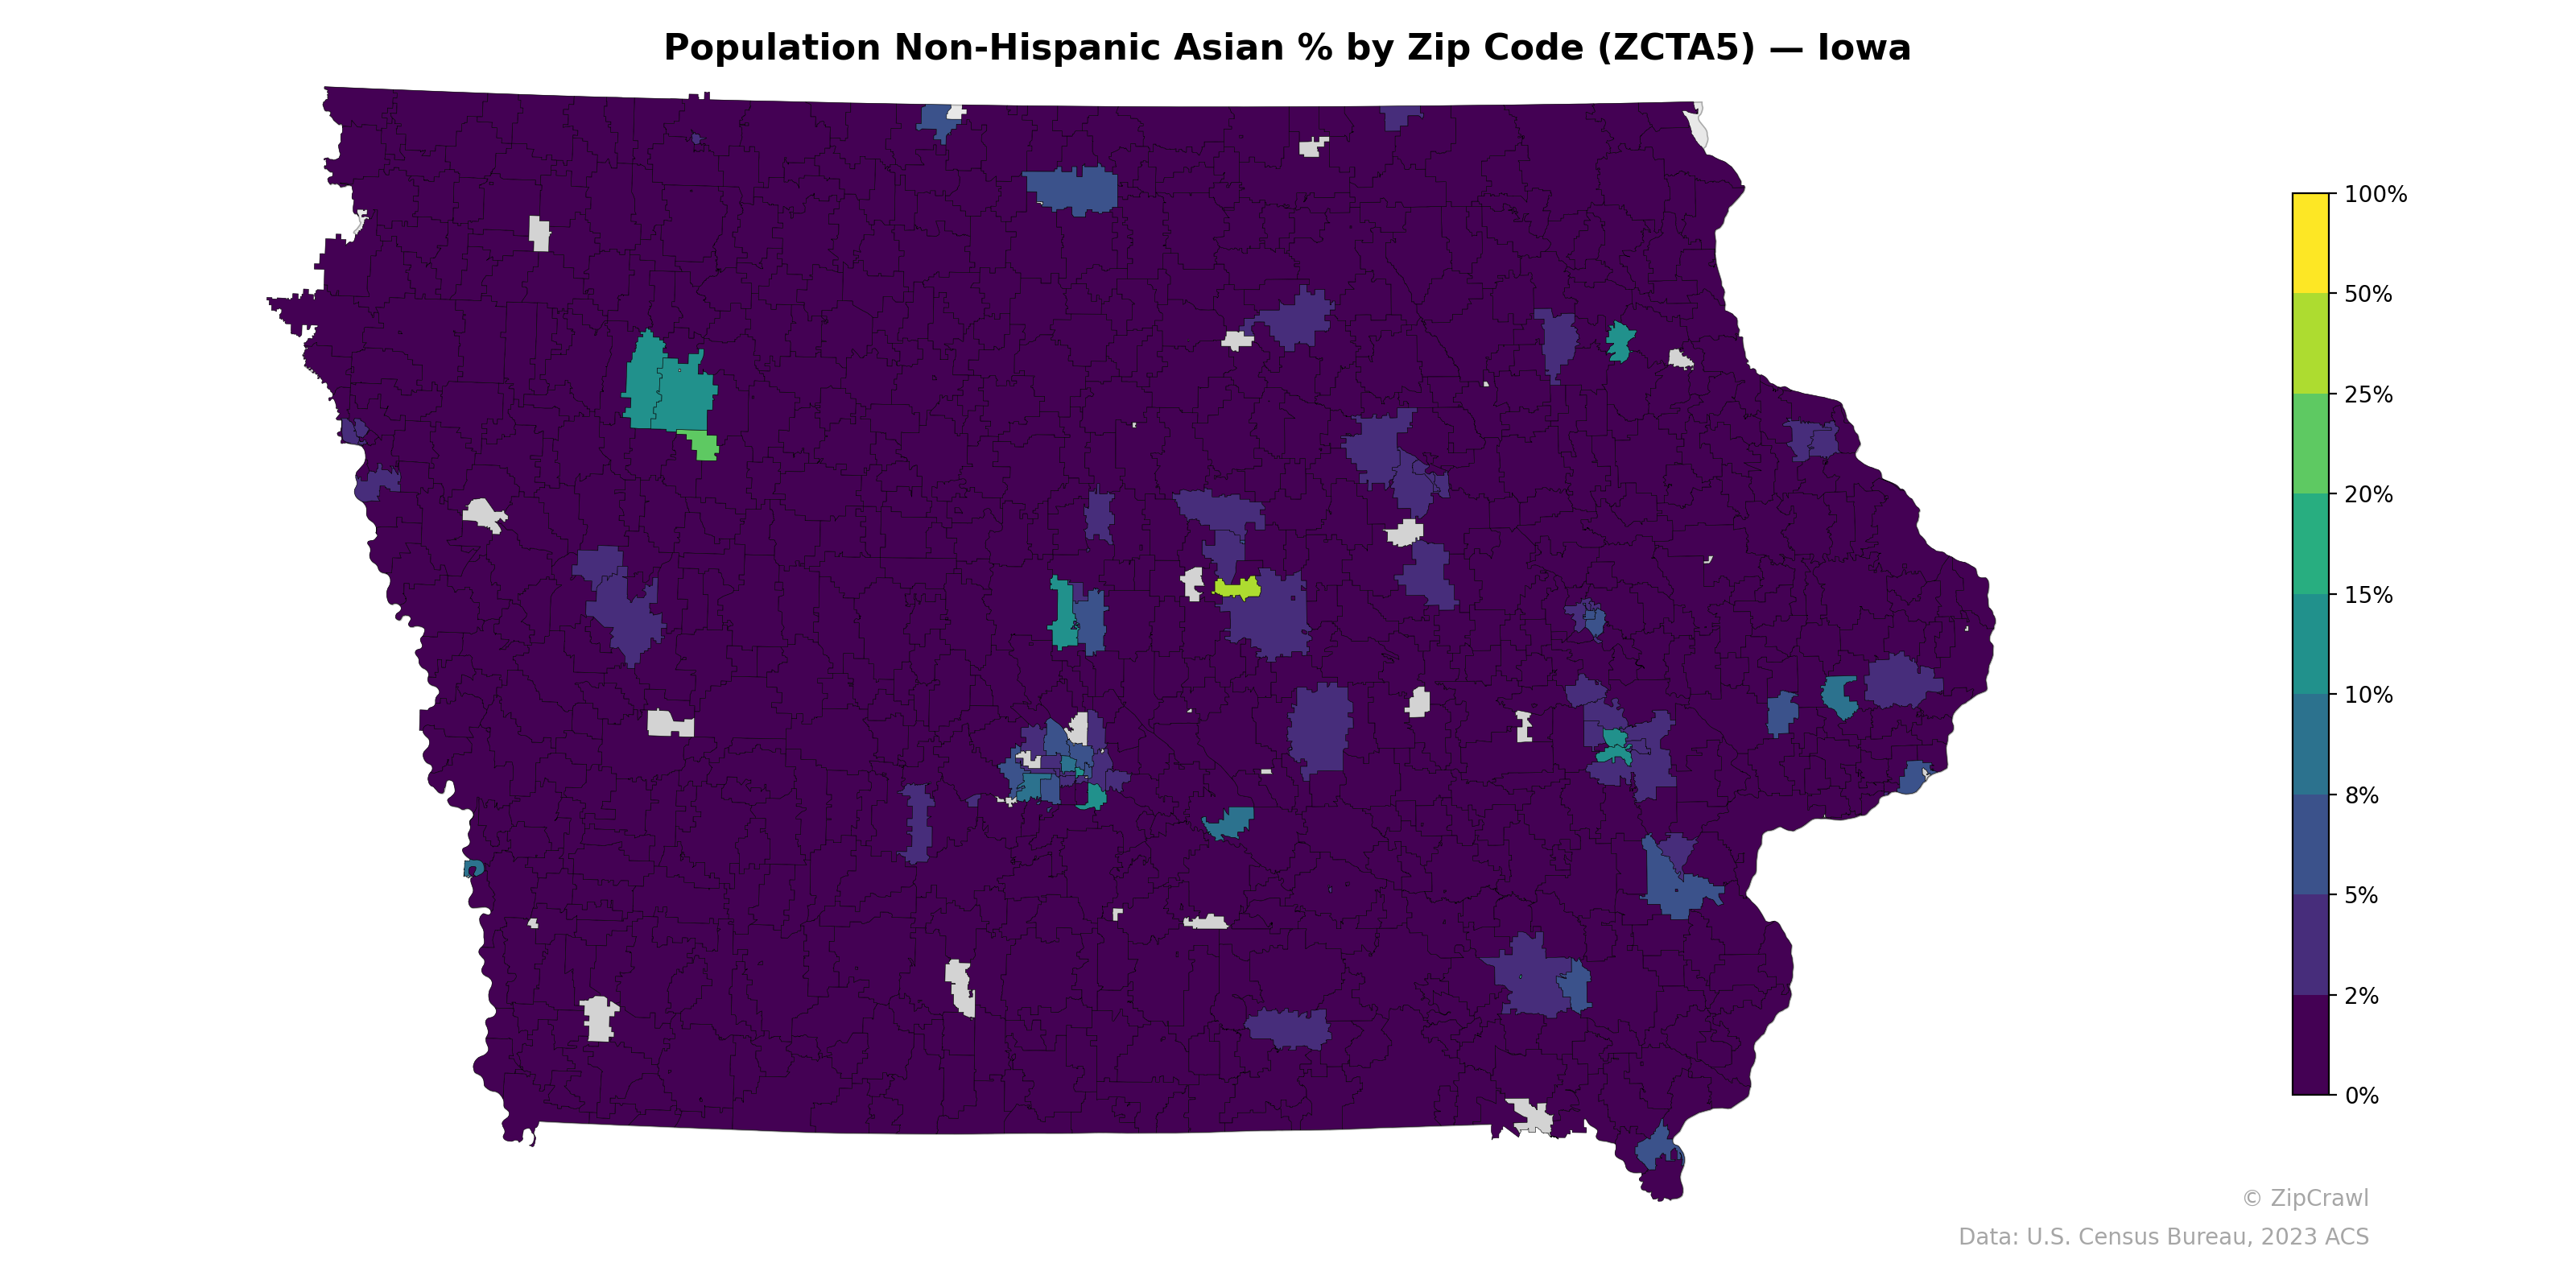
The highest concentrations of Non-Hispanic Asian residents in Iowa cluster around major university and metropolitan areas, with the most prominent hotspot in the Ames/Story County area (home to Iowa State University) showing percentages in the 10–25% range, alongside notable concentrations in the Iowa City/Coralville corridor and portions of the Des Moines metro. Secondary clusters appear in Cedar Rapids, Waterloo, and the Quad Cities region on the eastern border, generally ranging from 2–8%. The vast majority of rural zip codes across the state register at or near 0%, creating a stark urban-rural divide that underscores how the state's Asian population is heavily concentrated in a handful of educational and economic centers.
Data: U.S. Census Bureau, 2023 ACS
Explore
- Population Non-Hispanic White % by Zip Code (ZCTA5) — Florida
- Population Hispanic % by Zip Code (ZCTA5) — Nevada
- Married Couple (% of all Households) by Zip Code (ZCTA5) — Iowa
- % of Population on Food Stamps or SNAP (Last 12 Months), by Zip Code (ZCTA5) — Iowa
- Population Non-Hispanic White % by Zip Code (ZCTA5) — Nevada
- Population Non-Hispanic Black % by Zip Code (ZCTA5) — Nevada
- Median Age by Zip Code (ZCTA5) — Nevada
- Household Median Income by Zip Code (ZCTA5) — Nevada
- U.S. Citizens (% of Population Over 18) by Zip Code (ZCTA5) — Nevada
- Housing Vacancy Rate by Zip Code (ZCTA5) — Iowa
- Housing Owner-Occupied Median Value ($), by County
- % of Population without Health Insurance, by Zip Code (ZCTA5) — Dallas Metro
- % of Population without Health Insurance, by Zip Code (ZCTA5) — New York
- Population Hispanic % by Zip Code (ZCTA5) — Florida
- Population Non-Hispanic Black % by Zip Code (ZCTA5) — Florida
- Median Age by Zip Code (ZCTA5) — Florida
- Population Non-Hispanic American Indian % by Zip Code (ZCTA5) — Florida
- % of Population on Food Stamps or SNAP (Last 12 Months), by Zip Code (ZCTA5) — California
- U.S. Citizens (% of Population Over 18) by Zip Code (ZCTA5) — Florida
- Household Median Income by Zip Code (ZCTA5) — Florida
- High School Graduate (% of Over 25) by Zip Code (ZCTA5) — Florida
- Household Average Size by Zip Code (ZCTA5) — Connecticut
- High School Graduate (% of Over 25) by Zip Code (ZCTA5) — Connecticut
- Married Couple (% of all Households) by Zip Code (ZCTA5) — Connecticut
- Housing Median Monthly Rent ($), by Zip Code (ZCTA5) — Nevada
- Bachelor's Degree or Higher (% of Over 25) by Zip Code (ZCTA5) — Connecticut
- Median Age by Zip Code (ZCTA5) — Iowa
- Population Hispanic % by Zip Code (ZCTA5) — Mississippi
- Population Non-Hispanic American Indian % by Zip Code (ZCTA5) — Connecticut
- Household Median Income by Zip Code (ZCTA5) — Iowa
- Population Non-Hispanic Asian % by Zip Code (ZCTA5) — Idaho
- Population Non-Hispanic Asian % by Zip Code (ZCTA5) — Indiana
- Population Non-Hispanic Asian % by Zip Code (ZCTA5) — Utah
- Population Non-Hispanic Asian % by Zip Code (ZCTA5) — Ohio
- Population Non-Hispanic Asian % by Zip Code (ZCTA5) — Texas
- Population Non-Hispanic Asian % by Zip Code (ZCTA5) — Hawaii
- Population Non-Hispanic Asian % by Zip Code (ZCTA5) — Maine
- Population Non-Hispanic Asian % by Zip Code (ZCTA5) — Oregon
- Population Non-Hispanic Asian % by Zip Code (ZCTA5) — Nevada
- Population Non-Hispanic Asian % by Zip Code (ZCTA5) — Alaska