NOTE: Gray indicates insufficient data or a suppressed estimate.
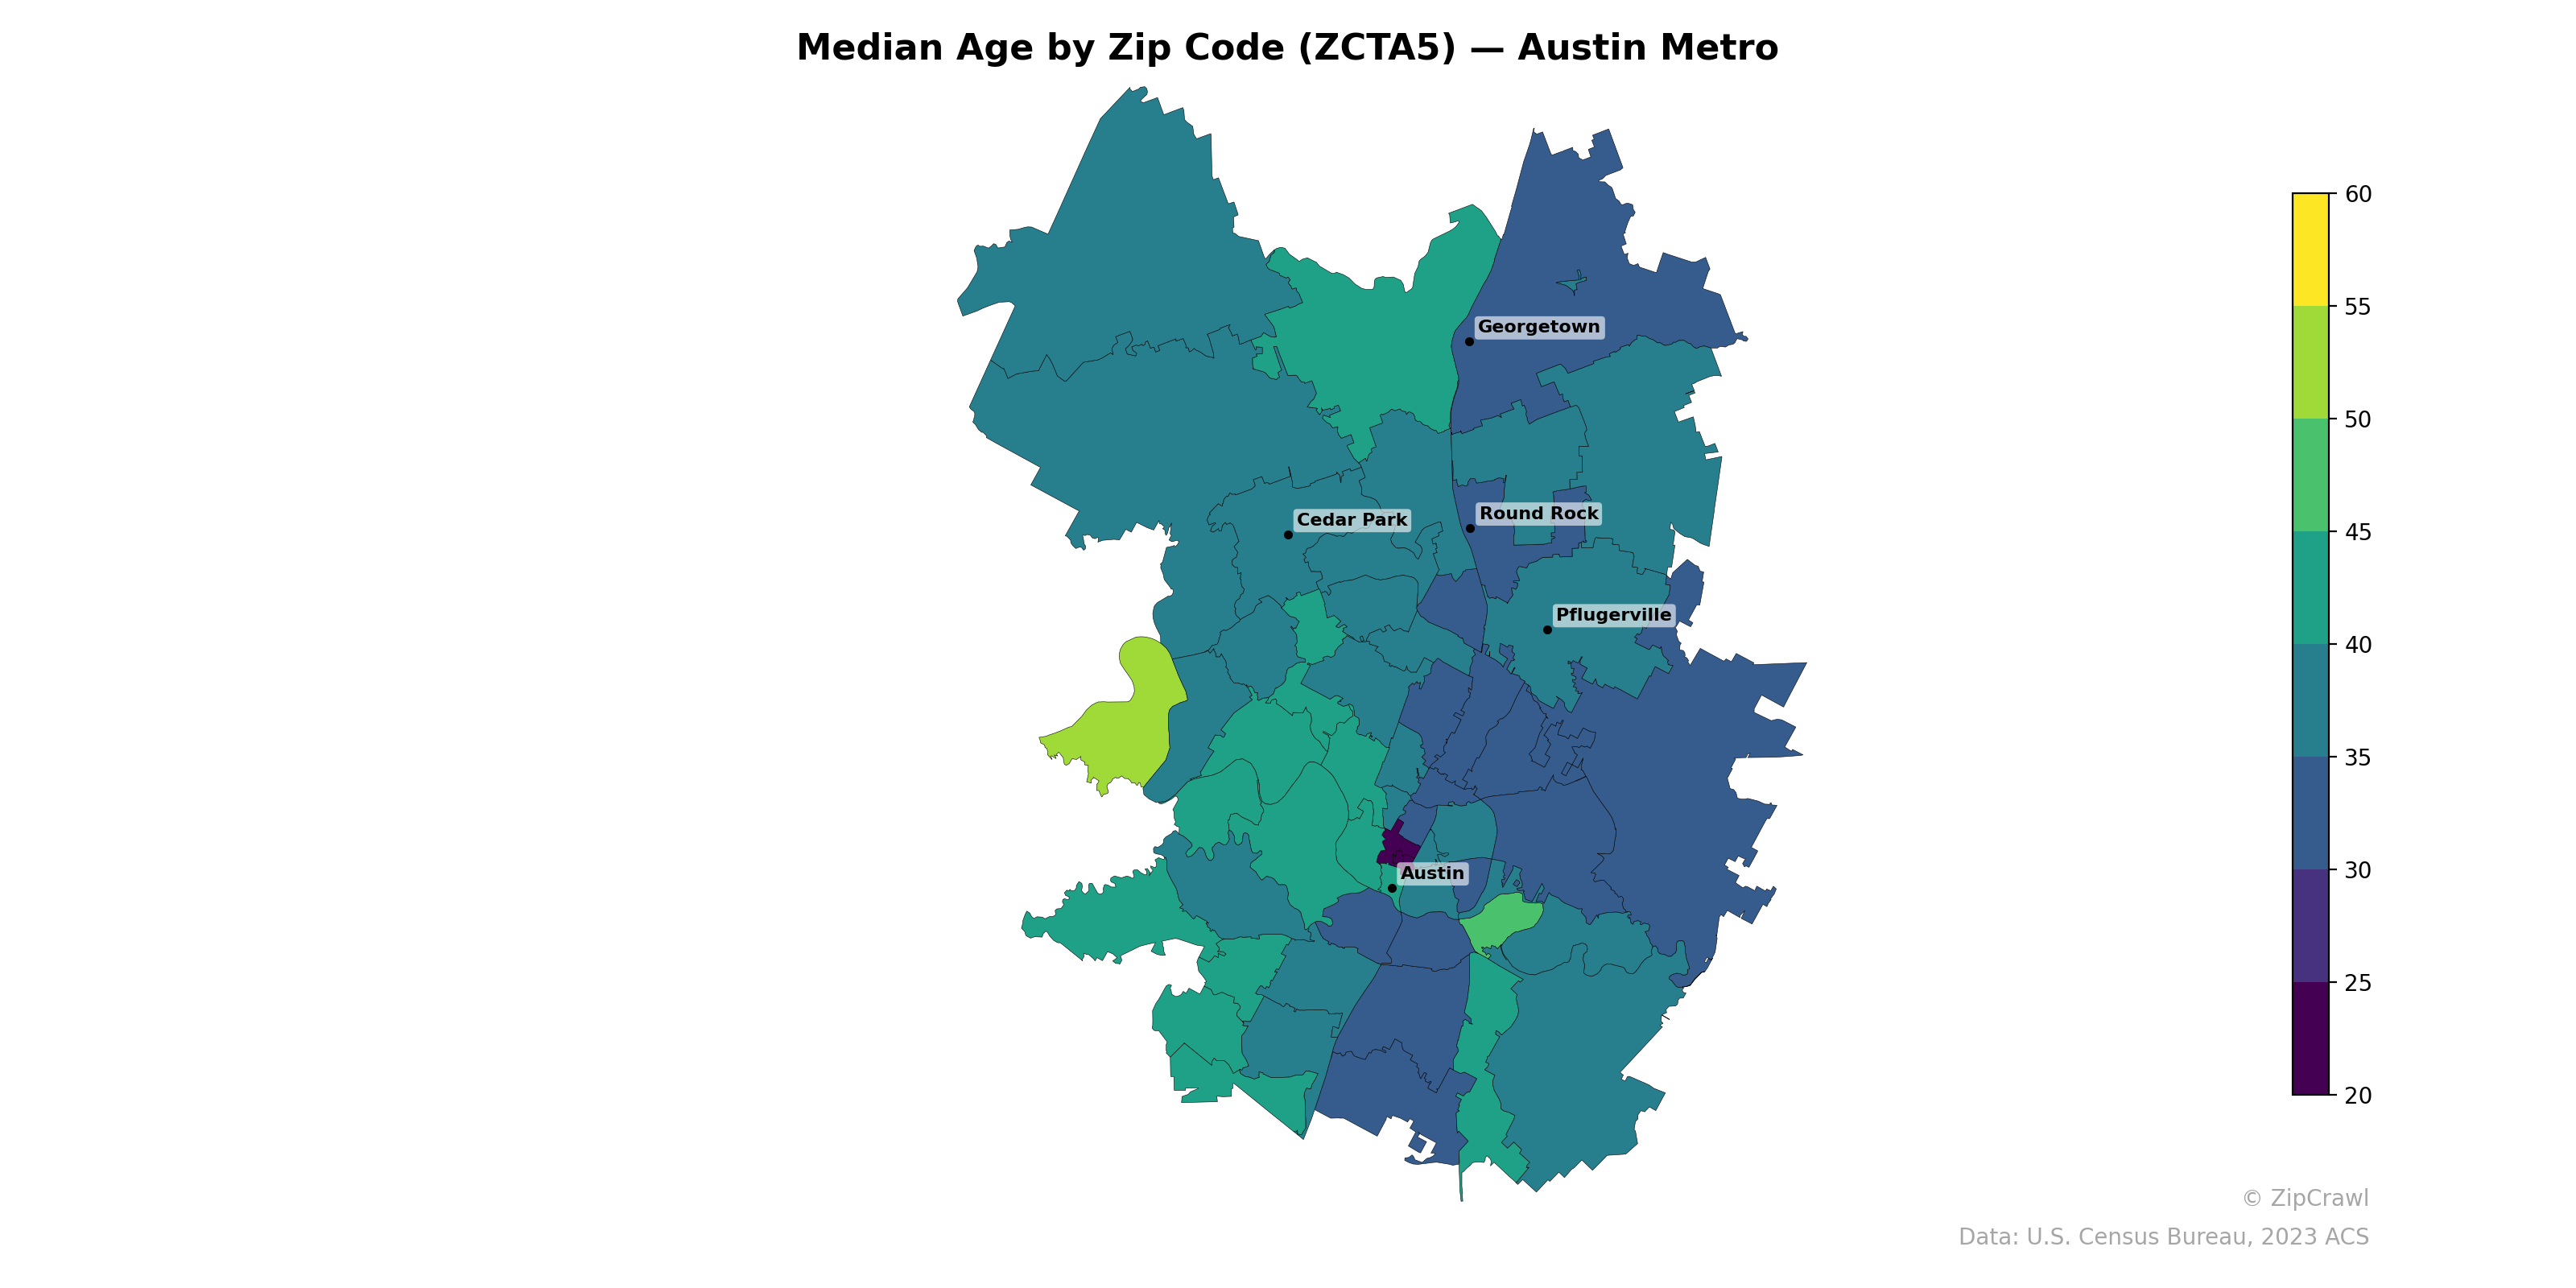
The youngest median ages in the Austin metro concentrate in a small cluster near downtown Austin, where the deep purple tones indicate median ages around 20–25, likely reflecting the University of Texas student population. Outer suburban and exurban areas to the north—particularly around Georgetown and the northern periphery—skew older, with median ages reaching into the mid-40s to low 50s, consistent with established and retirement-oriented communities. A notable outlier appears on the western edge of the metro, where a single zip code displays a distinctly high median age (approximately 55–60), standing in sharp contrast to the surrounding areas in the mid-30s range.
Data: U.S. Census Bureau, 2023 ACS
Explore
- Population Hispanic % by Zip Code (ZCTA5) — Texas
- Population Hispanic % by Zip Code (ZCTA5) — Austin Metro
- Population Non-Hispanic Asian % by Zip Code (ZCTA5) — San Antonio Metro
- Household Median Income by Zip Code (ZCTA5) — Austin Metro
- Population Non-Hispanic American Indian % by Zip Code (ZCTA5) — Austin Metro
- U.S. Citizens (% of Population Over 18) by Zip Code (ZCTA5) — Austin Metro
- Population Non-Hispanic Black % by Zip Code (ZCTA5) — Austin Metro
- % of Population on Food Stamps or SNAP (Last 12 Months), by Zip Code (ZCTA5) — San Antonio Metro
- High School Graduate (% of Over 25) by Zip Code (ZCTA5) — Austin Metro
- Population Non-Hispanic White % by Zip Code (ZCTA5) — Austin Metro
- High School Graduate (% of Over 25) by County
- Population Non-Hispanic White % by Zip Code (ZCTA5) — Texas
- U.S. Citizens (% of Population Over 18) by Zip Code (ZCTA5) — Texas
- Population Non-Hispanic Asian % by Zip Code (ZCTA5) — Chicago Metro
- Population Non-Hispanic American Indian % by Zip Code (ZCTA5) — Texas
- Household Median Income by Zip Code (ZCTA5) — Texas
- Population Non-Hispanic Black % by Zip Code (ZCTA5) — Texas
- High School Graduate (% of Over 25) by Zip Code (ZCTA5) — Texas
- % of Population on Food Stamps or SNAP (Last 12 Months), by Zip Code (ZCTA5) — Chicago Metro
- Housing Owner-Occupied Median Value ($), by Zip Code (ZCTA5) — Baltimore Metro
- % of Population without Health Insurance, by Zip Code (ZCTA5) — Baltimore Metro
- Housing Median Monthly Rent ($), by Zip Code (ZCTA5) — Baltimore Metro
- U.S. Citizens (% of Population Over 18) by Zip Code (ZCTA5) — Baltimore Metro
- High School Graduate (% of Over 25) by Zip Code (ZCTA5) — Baltimore Metro
- Population Non-Hispanic Asian % by Zip Code (ZCTA5) — Charlotte Metro
- Household Median Income by Zip Code (ZCTA5) — Baltimore Metro
- % of Population on Food Stamps or SNAP (Last 12 Months), by Zip Code (ZCTA5) — Charlotte Metro
- % of Households with Broadband Internet, by Zip Code (ZCTA5) — Baltimore Metro
- Housing Owner-Occupied % of Units, by Zip Code (ZCTA5) — Baltimore Metro
- Bachelor's Degree or Higher (% of Over 25) by Zip Code (ZCTA5) — Baltimore Metro
- Median Age by Zip Code (ZCTA5) — Miami Metro
- Median Age by Zip Code (ZCTA5) — Houston Metro
- Median Age by Zip Code (ZCTA5) — Tampa Metro
- Median Age by Zip Code (ZCTA5) — Detroit Metro
- Median Age by Zip Code (ZCTA5) — Boston Metro
- Median Age by Zip Code (ZCTA5) — Atlanta Metro
- Median Age by Zip Code (ZCTA5) — Chicago Metro
- Median Age by Zip Code (ZCTA5) — Dallas Metro
- Median Age by Zip Code (ZCTA5) — Denver Metro
- Median Age by Zip Code (ZCTA5) — Phoenix Metro