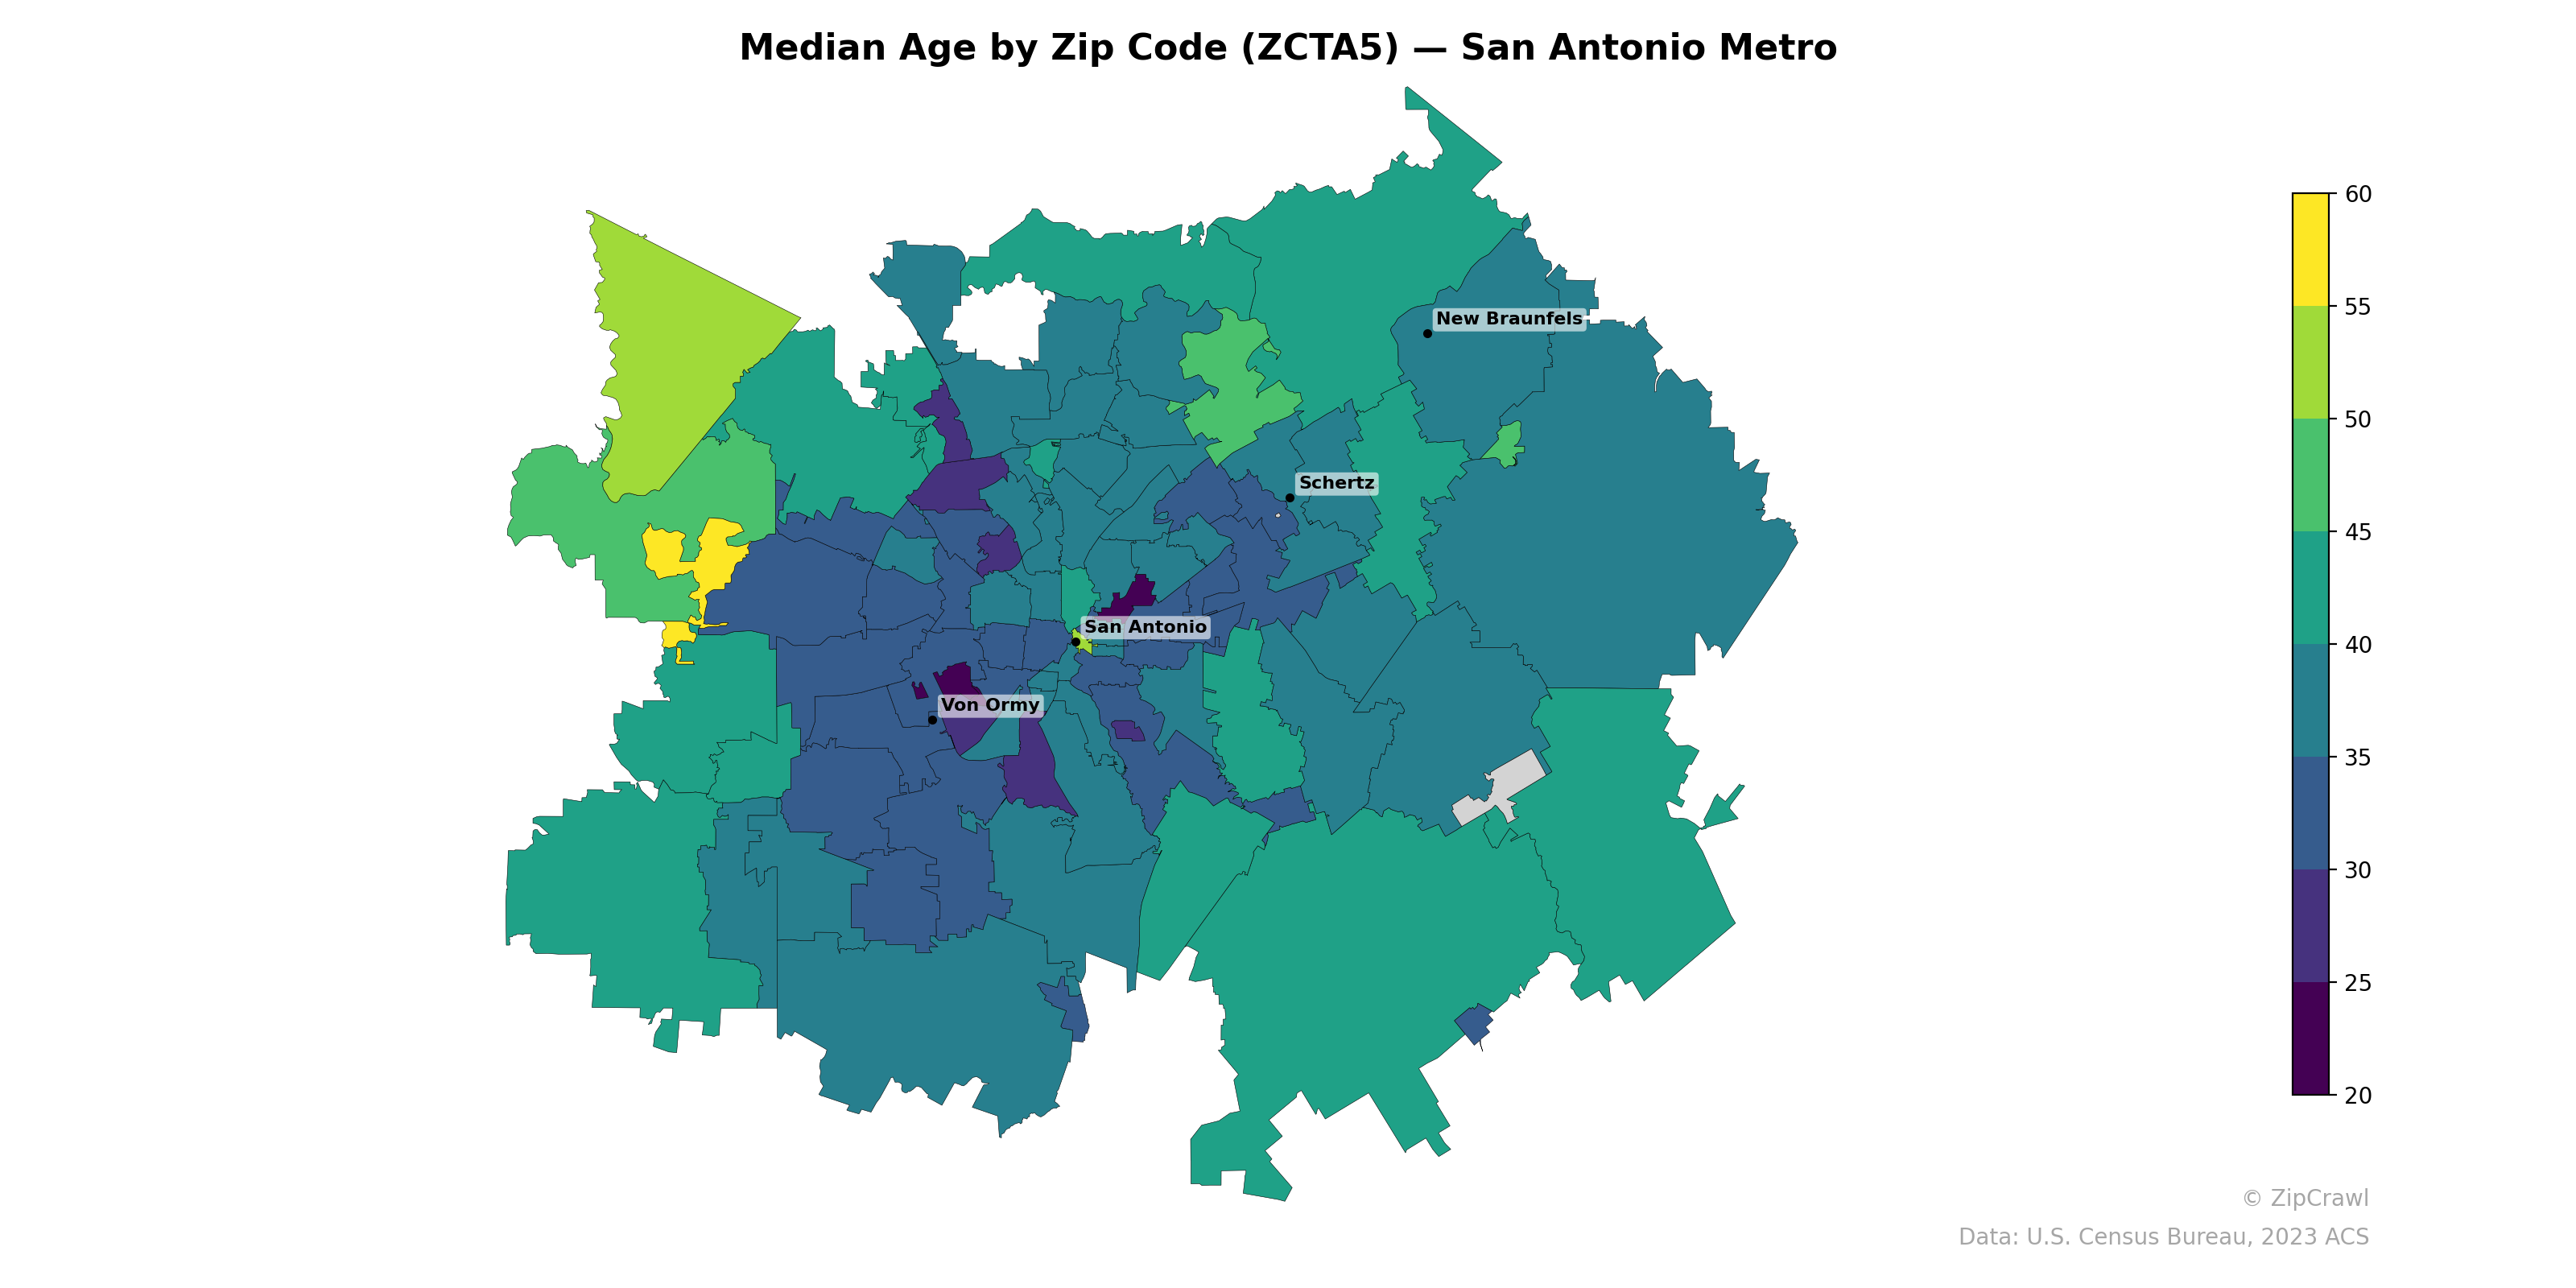
NOTE: Gray indicates insufficient data or a suppressed estimate.
The San Antonio metro exhibits a clear age gradient radiating outward from the urban core, where zip codes in and around downtown register median ages in the low-to-mid 20s and 30s, contrasting sharply with suburban and exurban areas that trend into the 40s and 50s. A notable cluster of the oldest median ages (55–60+) appears in the western periphery near the Medina County border, with additional pockets of older populations in the northern reaches toward New Braunfels and the far northeast. The youngest zip codes concentrate tightly around central San Antonio and areas south of Von Ormy, likely reflecting higher concentrations of military personnel, university students, and younger family households.
Data: U.S. Census Bureau, 2023 ACS
Explore
- Population Non-Hispanic American Indian % by Zip Code (ZCTA5) — San Antonio Metro
- U.S. Citizens (% of Population Over 18) by Zip Code (ZCTA5) — San Antonio Metro
- % of Population on Food Stamps or SNAP (Last 12 Months), by Zip Code (ZCTA5) — St. Louis Metro
- High School Graduate (% of Over 25) by Zip Code (ZCTA5) — San Antonio Metro
- Population Non-Hispanic Black % by Zip Code (ZCTA5) — San Antonio Metro
- Population Non-Hispanic Asian % by Zip Code (ZCTA5) — St. Louis Metro
- Population Hispanic % by Zip Code (ZCTA5) — San Antonio Metro
- Population Non-Hispanic White % by Zip Code (ZCTA5) — San Antonio Metro
- Household Median Income by Zip Code (ZCTA5) — San Antonio Metro
- High School Graduate (% of Over 25) by County
- Population Non-Hispanic White % by Zip Code (ZCTA5) — Texas
- U.S. Citizens (% of Population Over 18) by Zip Code (ZCTA5) — Texas
- % of Population on Food Stamps or SNAP (Last 12 Months), by Zip Code (ZCTA5) — Chicago Metro
- Population Non-Hispanic Black % by Zip Code (ZCTA5) — Texas
- Population Hispanic % by Zip Code (ZCTA5) — Texas
- Population Non-Hispanic American Indian % by Zip Code (ZCTA5) — Texas
- High School Graduate (% of Over 25) by Zip Code (ZCTA5) — Texas
- Household Median Income by Zip Code (ZCTA5) — Texas
- Population Non-Hispanic Asian % by Zip Code (ZCTA5) — Chicago Metro
- Housing Median Monthly Rent ($), by Zip Code (ZCTA5) — Baltimore Metro
- Housing Owner-Occupied % of Units, by Zip Code (ZCTA5) — Baltimore Metro
- Housing % of Units Built Since 2010, by Zip Code (ZCTA5) — Baltimore Metro
- Household Median Income by Zip Code (ZCTA5) — Baltimore Metro
- Bachelor's Degree or Higher (% of Over 25) by Zip Code (ZCTA5) — Baltimore Metro
- % of Population on Food Stamps or SNAP (Last 12 Months), by Zip Code (ZCTA5) — Charlotte Metro
- High School Graduate (% of Over 25) by Zip Code (ZCTA5) — Baltimore Metro
- U.S. Citizens (% of Population Over 18) by Zip Code (ZCTA5) — Baltimore Metro
- % of Population without Health Insurance, by Zip Code (ZCTA5) — Baltimore Metro
- Housing Owner-Occupied Median Value ($), by Zip Code (ZCTA5) — Baltimore Metro
- % of Households with Broadband Internet, by Zip Code (ZCTA5) — Baltimore Metro
- Median Age by Zip Code (ZCTA5) — San Diego Metro
- Median Age by Zip Code (ZCTA5) — Boston Metro
- Median Age by Zip Code (ZCTA5) — Atlanta Metro
- Median Age by Zip Code (ZCTA5) — Miami Metro
- Median Age by Zip Code (ZCTA5) — Houston Metro
- Median Age by Zip Code (ZCTA5) — Seattle Metro
- Median Age by Zip Code (ZCTA5) — San Francisco Metro
- Median Age by Zip Code (ZCTA5) — Tampa Metro
- Median Age by Zip Code (ZCTA5) — Detroit Metro
- Median Age by Zip Code (ZCTA5) — Austin Metro