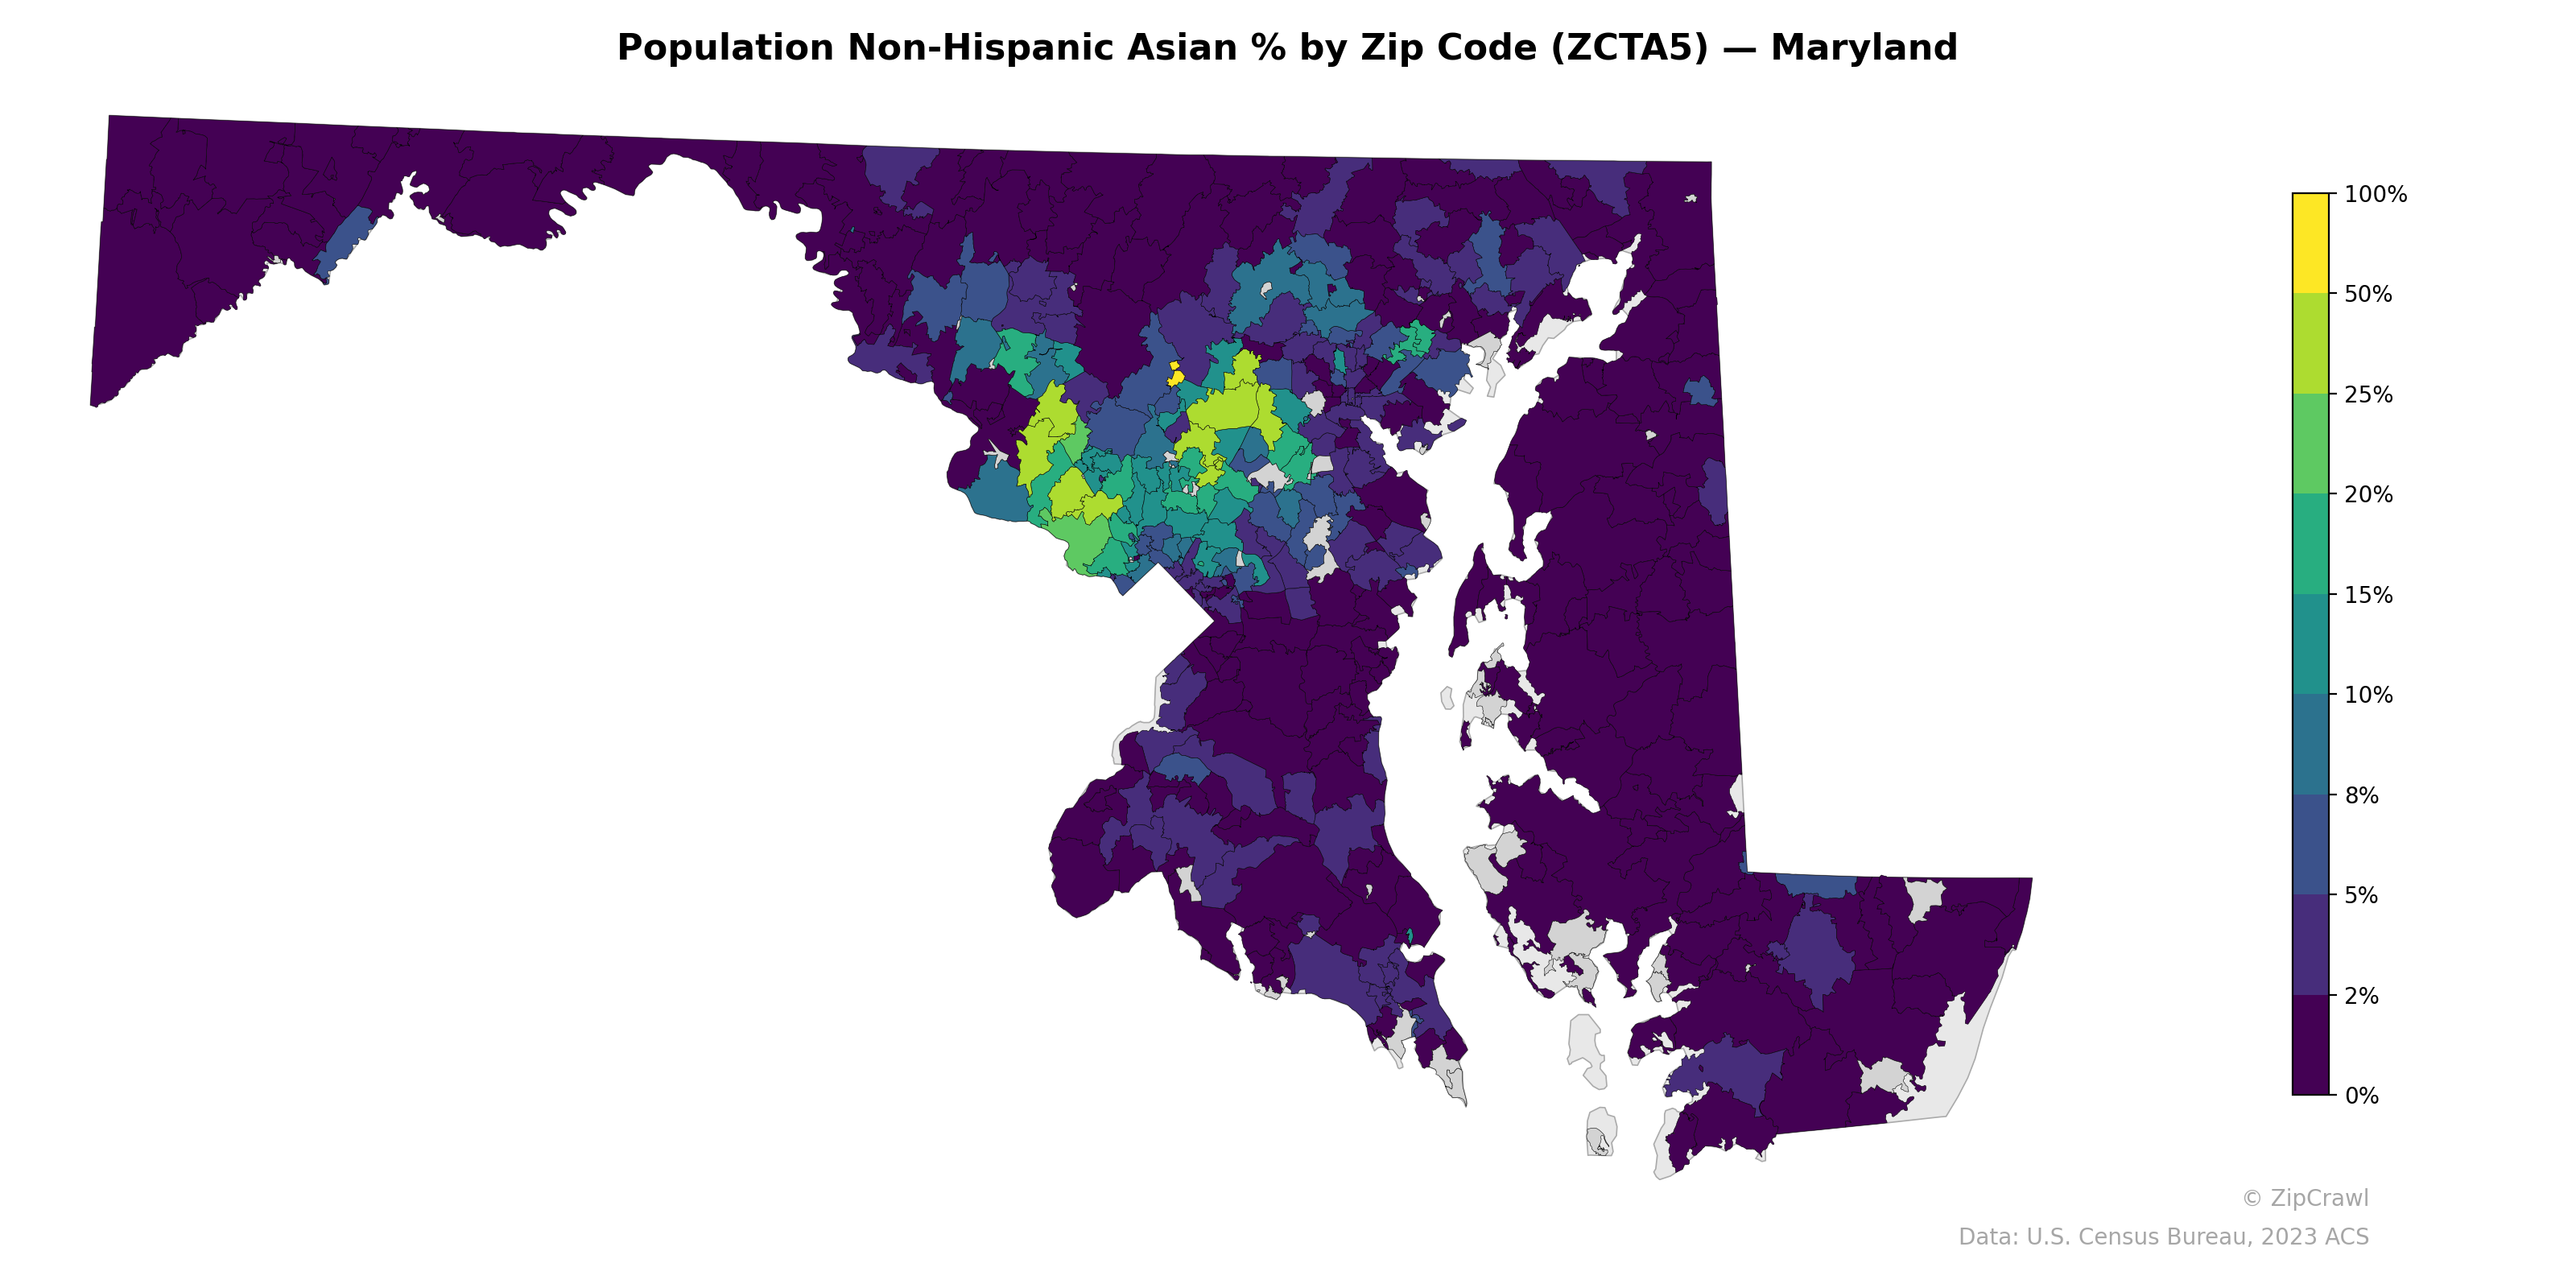
NOTE: Gray indicates insufficient data or a suppressed estimate.
The highest concentrations of Non-Hispanic Asian residents in Maryland cluster tightly in the suburban Washington, D.C. corridor, particularly in Montgomery and Howard counties, where several zip codes exceed 25–50% Asian population. This central Maryland concentration contrasts sharply with the Eastern Shore, Southern Maryland, and western Allegany/Garrett counties, which remain almost uniformly below 2%. A secondary but notably weaker band of moderate Asian population (5–15%) extends into parts of Anne Arundel and Prince George's counties, suggesting outward suburban diffusion from the primary D.C.-adjacent core.
Data: U.S. Census Bureau, 2023 ACS
Explore
- % of Population on Food Stamps or SNAP (Last 12 Months), by Zip Code (ZCTA5) — Maryland
- Population Hispanic % by Zip Code (ZCTA5) — Boston Metro
- Population Non-Hispanic Black % by Zip Code (ZCTA5) — Boston Metro
- High School Graduate (% of Over 25) by Zip Code (ZCTA5) — Boston Metro
- Median Age by Zip Code (ZCTA5) — Boston Metro
- U.S. Citizens (% of Population Over 18) by Zip Code (ZCTA5) — Boston Metro
- Household Median Income by Zip Code (ZCTA5) — Boston Metro
- Population Non-Hispanic White % by Zip Code (ZCTA5) — Boston Metro
- Population Non-Hispanic American Indian % by Zip Code (ZCTA5) — Boston Metro
- Population Non-Hispanic American Indian % by Zip Code (ZCTA5) — Vermont
- % of Population without Health Insurance, by County
- Household Median Income by Zip Code (ZCTA5) — Chicago Metro
- U.S. Citizens (% of Population Over 18) by Zip Code (ZCTA5) — Chicago Metro
- Median Age by Zip Code (ZCTA5) — Chicago Metro
- % of Population on Food Stamps or SNAP (Last 12 Months), by Zip Code (ZCTA5) — Los Angeles Metro
- Population Non-Hispanic White % by Zip Code (ZCTA5) — Chicago Metro
- Population Hispanic % by Zip Code (ZCTA5) — Chicago Metro
- Population Non-Hispanic Black % by Zip Code (ZCTA5) — Chicago Metro
- Population Non-Hispanic American Indian % by Zip Code (ZCTA5) — Chicago Metro
- High School Graduate (% of Over 25) by Zip Code (ZCTA5) — Chicago Metro
- Housing Owner-Occupied % of Units, by Zip Code (ZCTA5) — Boston Metro
- % of Households with Broadband Internet, by Zip Code (ZCTA5) — Boston Metro
- Housing Owner-Occupied Median Value ($), by Zip Code (ZCTA5) — Boston Metro
- Housing Owner-Occupied % of Units, by Zip Code (ZCTA5) — Seattle Metro
- Housing Median Monthly Rent ($), by Zip Code (ZCTA5) — Boston Metro
- % of Population without Health Insurance, by Zip Code (ZCTA5) — Seattle Metro
- Population Non-Hispanic American Indian % by Zip Code (ZCTA5) — San Francisco Metro
- Bachelor's Degree or Higher (% of Over 25) by Zip Code (ZCTA5) — Boston Metro
- % of Population without Health Insurance, by Zip Code (ZCTA5) — Boston Metro
- High School Graduate (% of Over 25) by Zip Code (ZCTA5) — Detroit Metro
- Population Non-Hispanic Asian % by Zip Code (ZCTA5) — Maine
- Population Non-Hispanic Asian % by Zip Code (ZCTA5) — Portland Metro
- Population Non-Hispanic Asian % by Zip Code (ZCTA5) — Rhode Island
- Population Non-Hispanic Asian % by Zip Code (ZCTA5) — Ohio
- Population Non-Hispanic Asian % by Zip Code (ZCTA5) — Iowa
- Population Non-Hispanic Asian % by Zip Code (ZCTA5) — Utah
- Population Non-Hispanic Asian % by Zip Code (ZCTA5) — Montana
- Population Non-Hispanic Asian % by Zip Code (ZCTA5) — Michigan
- Population Non-Hispanic Asian % by Zip Code (ZCTA5) — Texas
- Population Non-Hispanic Asian % by Zip Code (ZCTA5) — Nevada