NOTE: Gray indicates insufficient data or a suppressed estimate.
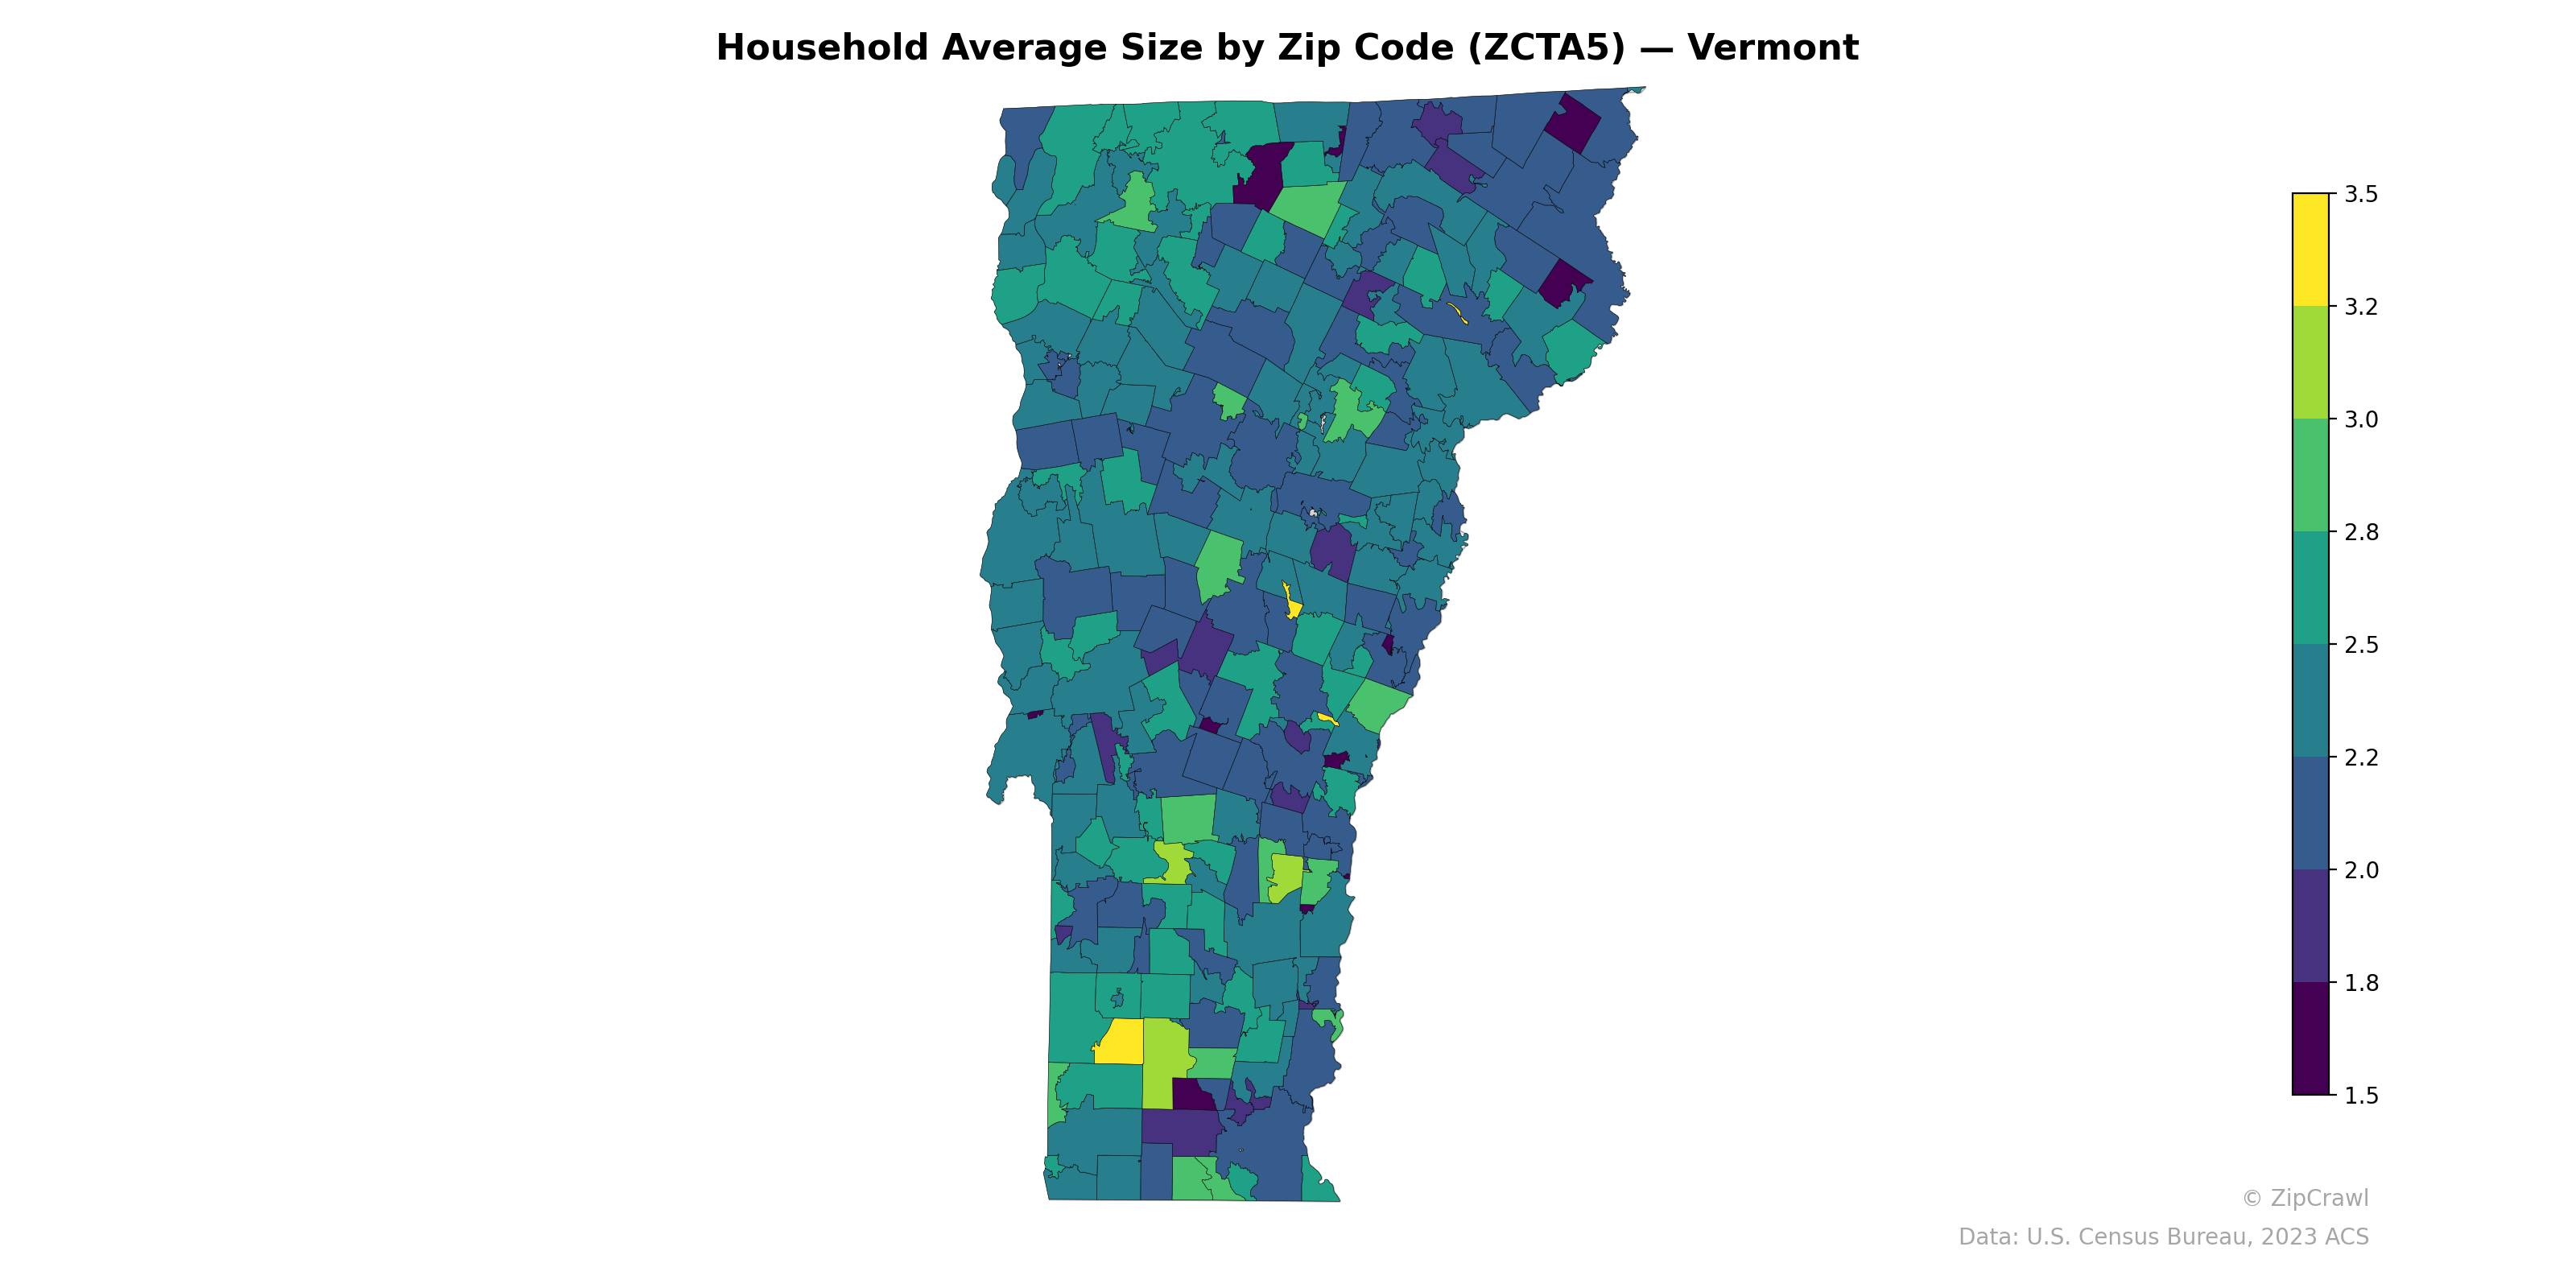
Northern Vermont, particularly in the rural areas of the Northeast Kingdom and along the Canadian border, tends toward higher average household sizes (2.8–3.2+), likely reflecting larger family households in agricultural and less densely populated communities. The Burlington metro area and central Vermont corridors display notably lower household sizes (1.8–2.2), consistent with higher concentrations of single-person households, college students, and smaller urban living arrangements. A distinct cluster of very low household sizes (1.5–1.8) appears in the southeastern corner near Brattleboro and in select areas around Montpelier, while scattered zip codes in the south-central region show pockets of higher values amid otherwise moderate surroundings.
Data: U.S. Census Bureau, 2023 ACS
Explore
- Population Non-Hispanic Asian % by Zip Code (ZCTA5) — New York
- Population Non-Hispanic American Indian % by Zip Code (ZCTA5) — Vermont
- High School Graduate (% of Over 25) by Zip Code (ZCTA5) — Vermont
- Bachelor's Degree or Higher (% of Over 25) by Zip Code (ZCTA5) — Vermont
- % of Households with Broadband Internet, by Zip Code (ZCTA5) — Vermont
- % of Population without Health Insurance, by Zip Code (ZCTA5) — Vermont
- Housing % of Units Built Since 2010, by Zip Code (ZCTA5) — Vermont
- Housing Median Monthly Rent ($), by Zip Code (ZCTA5) — Vermont
- Housing Owner-Occupied % of Units, by Zip Code (ZCTA5) — Vermont
- Housing Owner-Occupied Median Value ($), by Zip Code (ZCTA5) — Vermont
- Married Couple (% of all Households) by County
- High School Graduate (% of Over 25) by Zip Code (ZCTA5) — California
- Population Non-Hispanic American Indian % by Zip Code (ZCTA5) — Illinois
- High School Graduate (% of Over 25) by Zip Code (ZCTA5) — Illinois
- Population Non-Hispanic White % by Zip Code (ZCTA5) — Illinois
- Household Median Income by Zip Code (ZCTA5) — Illinois
- Population Hispanic % by Zip Code (ZCTA5) — Illinois
- High School Graduate (% of Over 25) by Zip Code (ZCTA5) — Boston Metro
- % of Population on Food Stamps or SNAP (Last 12 Months), by Zip Code (ZCTA5) — New York
- U.S. Citizens (% of Population Over 18) by Zip Code (ZCTA5) — Illinois
- Population Non-Hispanic Black % by Zip Code (ZCTA5) — Illinois
- Median Age by Zip Code (ZCTA5) — Illinois
- Population Non-Hispanic Asian % by Zip Code (ZCTA5) — Vermont
- Population Hispanic % by Zip Code (ZCTA5) — Washington D.C.
- Population Non-Hispanic American Indian % by Zip Code (ZCTA5) — Oregon
- Housing Vacancy Rate by Zip Code (ZCTA5) — Vermont
- % of Population on Food Stamps or SNAP (Last 12 Months), by Zip Code (ZCTA5) — Vermont
- Married Couple (% of all Households) by Zip Code (ZCTA5) — Vermont
- U.S. Citizens (% of Population Over 18) by Zip Code (ZCTA5) — Wyoming
- Household Median Income by Zip Code (ZCTA5) — Wyoming
- Household Average Size by Zip Code (ZCTA5) — Montana
- Household Average Size by Zip Code (ZCTA5) — Iowa
- Household Average Size by Zip Code (ZCTA5) — Ohio
- Household Average Size by Zip Code (ZCTA5) — Utah
- Household Average Size by Zip Code (ZCTA5) — Alaska
- Household Average Size by Zip Code (ZCTA5) — Maine
- Household Average Size by Zip Code (ZCTA5) — Idaho
- Household Average Size by Zip Code (ZCTA5) — Texas
- Household Average Size by Zip Code (ZCTA5) — Hawaii
- Household Average Size by Zip Code (ZCTA5) — Virginia