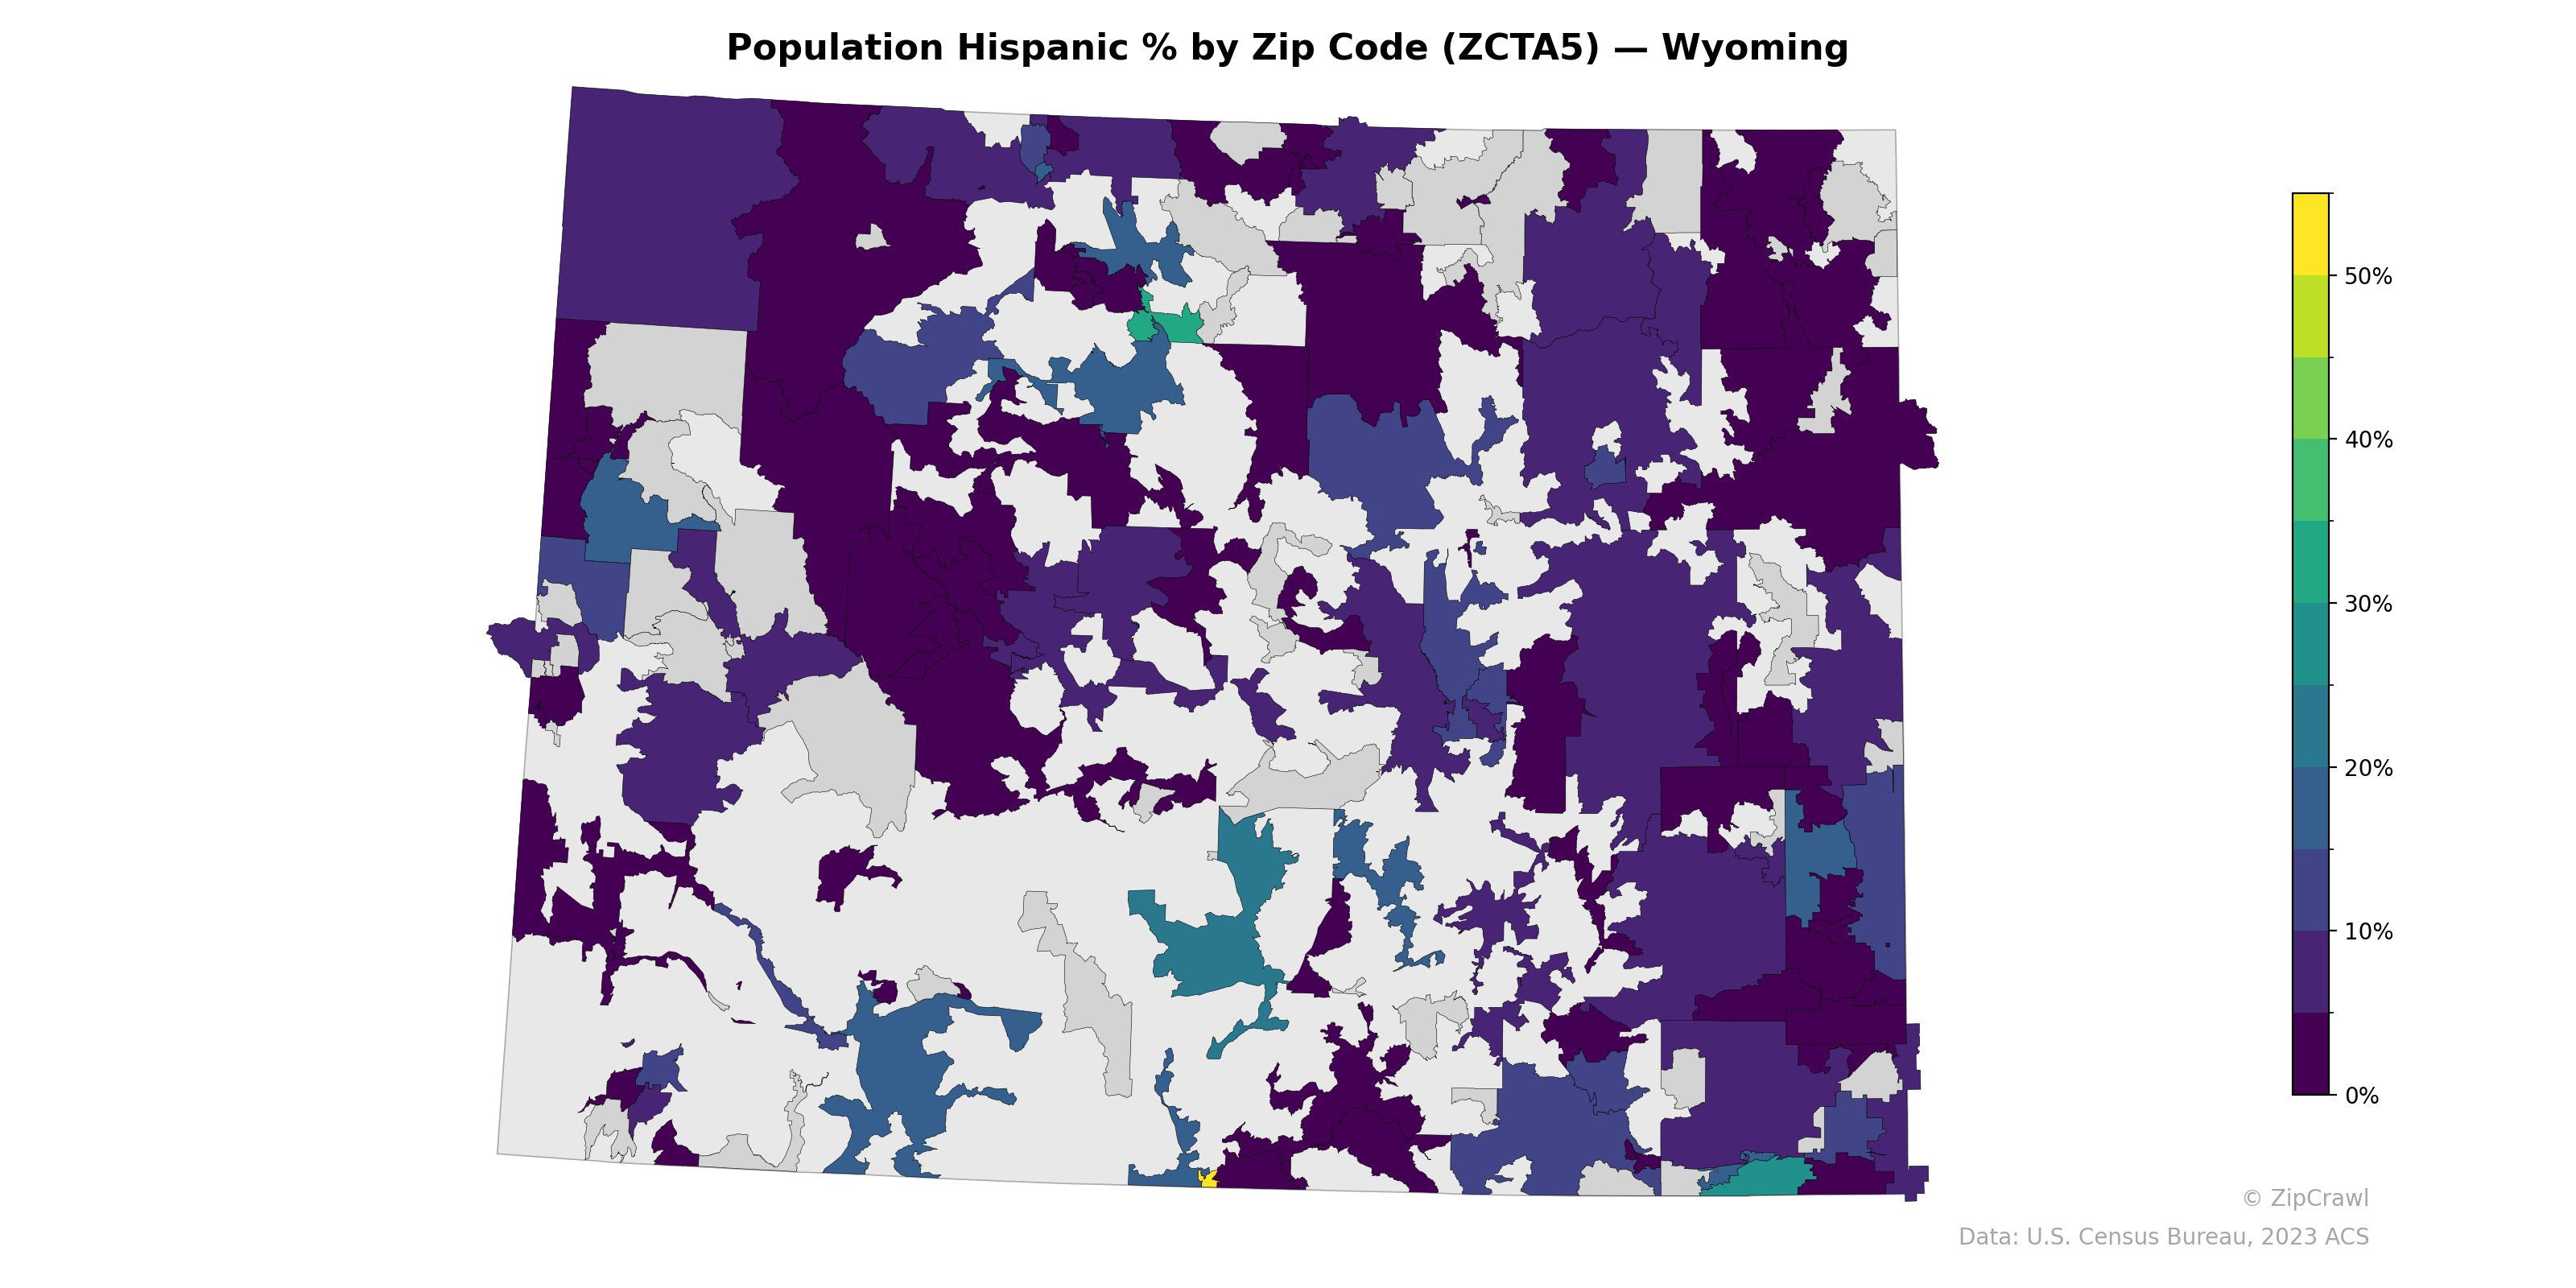
NOTE: Gray indicates insufficient data or a suppressed estimate.
Hispanic population shares across Wyoming's zip codes display notable concentration in the south-central region near the Colorado border, where a small cluster of ZCTAs reaches above 50%, likely corresponding to areas around Cheyenne and Laramie. Elevated Hispanic percentages in the 20–35% range also appear in scattered zip codes across the western and north-central parts of the state, potentially tied to agricultural and energy-sector communities such as those near Worland and the Wind River area. Much of the eastern and north-central interior shows very low Hispanic representation below 5%, with large swaths of gray indicating either minimal population or negligible Hispanic shares in the state's most rural and sparsely settled areas.
Data: U.S. Census Bureau, 2023 ACS
Explore
- % of Population on Food Stamps or SNAP (Last 12 Months), by Zip Code (ZCTA5) — New York
- Housing Vacancy Rate by Zip Code (ZCTA5) — Vermont
- Median Age by Zip Code (ZCTA5) — Wyoming
- U.S. Citizens (% of Population Over 18) by Zip Code (ZCTA5) — Wyoming
- % of Population on Food Stamps or SNAP (Last 12 Months), by Zip Code (ZCTA5) — Vermont
- Population Non-Hispanic Asian % by Zip Code (ZCTA5) — Vermont
- Married Couple (% of all Households) by Zip Code (ZCTA5) — Vermont
- Population Non-Hispanic Black % by Zip Code (ZCTA5) — Wyoming
- Population Non-Hispanic White % by Zip Code (ZCTA5) — Wyoming
- Household Median Income by Zip Code (ZCTA5) — Wyoming
- Married Couple (% of all Households) by County
- Housing % of Units Built Since 2010, by County
- Married Couple (% of all Households) by Zip Code (ZCTA5) — Boston Metro
- Married Couple (% of all Households) by Zip Code (ZCTA5) — California
- High School Graduate (% of Over 25) by Zip Code (ZCTA5) — Illinois
- Population Non-Hispanic White % by Zip Code (ZCTA5) — Illinois
- Household Median Income by Zip Code (ZCTA5) — Illinois
- Population Non-Hispanic Black % by Zip Code (ZCTA5) — Illinois
- Population Non-Hispanic American Indian % by Zip Code (ZCTA5) — Illinois
- U.S. Citizens (% of Population Over 18) by Zip Code (ZCTA5) — Illinois
- Population Non-Hispanic Asian % by Zip Code (ZCTA5) — New York
- Median Age by Zip Code (ZCTA5) — Illinois
- % of Households with Broadband Internet, by Zip Code (ZCTA5) — Vermont
- Bachelor's Degree or Higher (% of Over 25) by Zip Code (ZCTA5) — Vermont
- % of Population without Health Insurance, by Zip Code (ZCTA5) — Vermont
- High School Graduate (% of Over 25) by Zip Code (ZCTA5) — Oregon
- Housing Owner-Occupied % of Units, by Zip Code (ZCTA5) — Vermont
- Population Non-Hispanic American Indian % by Zip Code (ZCTA5) — Vermont
- High School Graduate (% of Over 25) by Zip Code (ZCTA5) — Vermont
- Housing % of Units Built Since 2010, by Zip Code (ZCTA5) — Vermont
- Population Hispanic % by Zip Code (ZCTA5) — Ohio
- Population Hispanic % by Zip Code (ZCTA5) — Utah
- Population Hispanic % by Zip Code (ZCTA5) — Iowa
- Population Hispanic % by Zip Code (ZCTA5) — Washington
- Population Hispanic % by Zip Code (ZCTA5) — Texas
- Population Hispanic % by Zip Code (ZCTA5) — Oregon
- Population Hispanic % by Zip Code (ZCTA5) — Idaho
- Population Hispanic % by Zip Code (ZCTA5) — Hawaii
- Population Hispanic % by Zip Code (ZCTA5) — Maine
- Population Hispanic % by Zip Code (ZCTA5) — Colorado