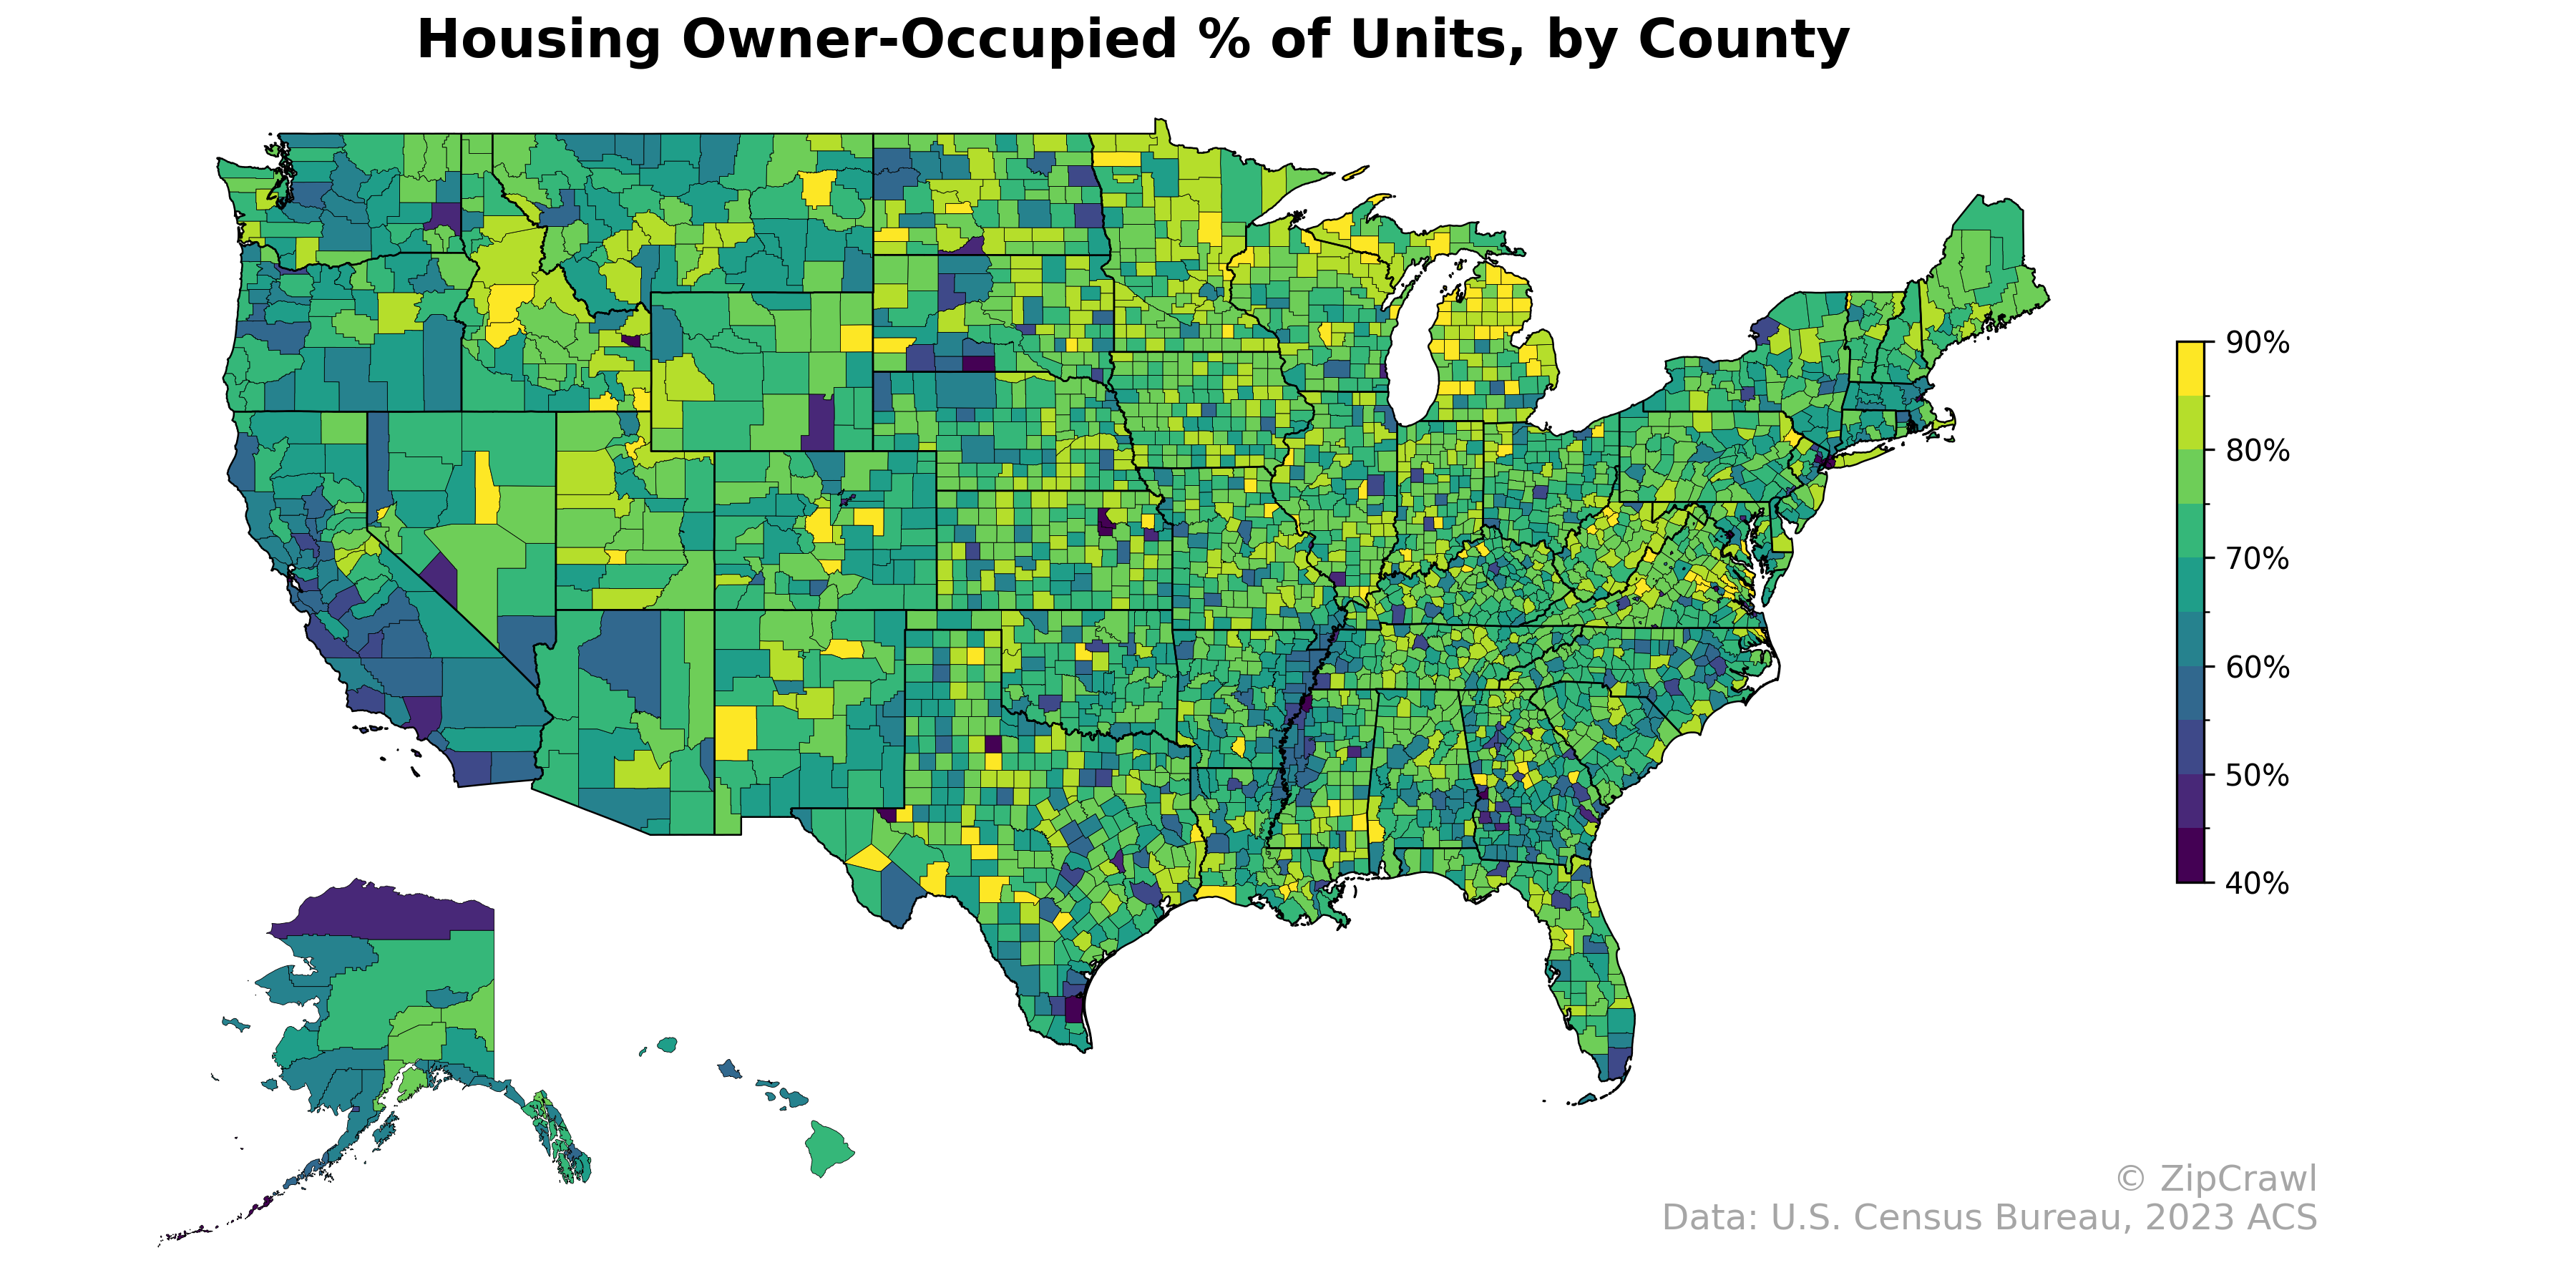
NOTE: Gray indicates insufficient data or a suppressed estimate.
Explore homeownership rates across American counties, a metric that captures wealth accumulation, housing affordability, and community stability. This map reveals the stark divide between rural counties where owning is the overwhelming norm and dense urban cores where rental markets dominate - reflecting a fundamental tension in American housing between the cultural ideal of homeownership and the economic reality of increasingly unaffordable purchase prices in high-opportunity metros.
Data: U.S. Census Bureau, 2023 ACS
Explore
- % of Households with Broadband Internet, by Zip Code (ZCTA5) — California
- Household Average Size by Zip Code (ZCTA5) — California
- % of Population without Health Insurance, by Zip Code (ZCTA5) — California
- Housing Vacancy Rate by Zip Code (ZCTA5) — California
- Housing % of Units Built Since 2010, by Zip Code (ZCTA5) — California
- Housing Owner-Occupied Median Value ($), by Zip Code (ZCTA5) — California
- Married Couple (% of all Households) by Zip Code (ZCTA5) — California
- Housing Median Monthly Rent ($), by Zip Code (ZCTA5) — California
- Bachelor's Degree or Higher (% of Over 25) by Zip Code (ZCTA5) — California
- Housing Vacancy Rate by Zip Code (ZCTA5) — Oregon
- Bachelor's Degree or Higher (% of Over 25) by Zip Code (ZCTA5) — Oregon
- High School Graduate (% of Over 25) by Zip Code (ZCTA5) — Oregon
- Household Average Size by Zip Code (ZCTA5) — Oregon
- Married Couple (% of all Households) by Zip Code (ZCTA5) — Oregon
- Population Non-Hispanic Asian % by Zip Code (ZCTA5) — Oregon
- Housing Owner-Occupied Median Value ($), by Zip Code (ZCTA5) — Oregon
- Household Median Income by Zip Code (ZCTA5) — Oregon
- Population Non-Hispanic White % by Zip Code (ZCTA5) — Oregon
- Housing Median Monthly Rent ($), by Zip Code (ZCTA5) — Oregon
- % of Households with Broadband Internet, by Zip Code (ZCTA5) — Oregon
- Median Age by Zip Code (ZCTA5) — Oregon
- Housing Vacancy Rate by Zip Code (ZCTA5) — Alabama
- U.S. Citizens (% of Population Over 18) by Zip Code (ZCTA5) — Oregon
- Population Hispanic % by Zip Code (ZCTA5) — Oregon
- Population Non-Hispanic American Indian % by Zip Code (ZCTA5) — Oregon
- Population Non-Hispanic Black % by Zip Code (ZCTA5) — Oregon
- % of Population without Health Insurance, by Zip Code (ZCTA5) — Oregon
- Housing % of Units Built Since 2010, by Zip Code (ZCTA5) — Oregon
- % of Population on Food Stamps or SNAP (Last 12 Months), by Zip Code (ZCTA5) — Oregon
- U.S. Citizens (% of Population Over 18) by Zip Code (ZCTA5) — Oklahoma
- Housing Owner-Occupied % of Units, by Zip Code (ZCTA5) — Ohio
- Housing Owner-Occupied % of Units, by Zip Code (ZCTA5) — Utah
- Housing Owner-Occupied % of Units, by Zip Code (ZCTA5) — Iowa
- Housing Owner-Occupied % of Units, by Zip Code (ZCTA5) — Wyoming
- Housing Owner-Occupied % of Units, by Zip Code (ZCTA5) — Idaho
- Housing Owner-Occupied % of Units, by Zip Code (ZCTA5) — Oregon
- Housing Owner-Occupied % of Units, by Zip Code (ZCTA5) — Hawaii
- Housing Owner-Occupied % of Units, by Zip Code (ZCTA5) — Texas
- Housing Owner-Occupied % of Units, by Zip Code (ZCTA5) — Maine
- Housing Owner-Occupied % of Units, by Zip Code (ZCTA5) — Colorado