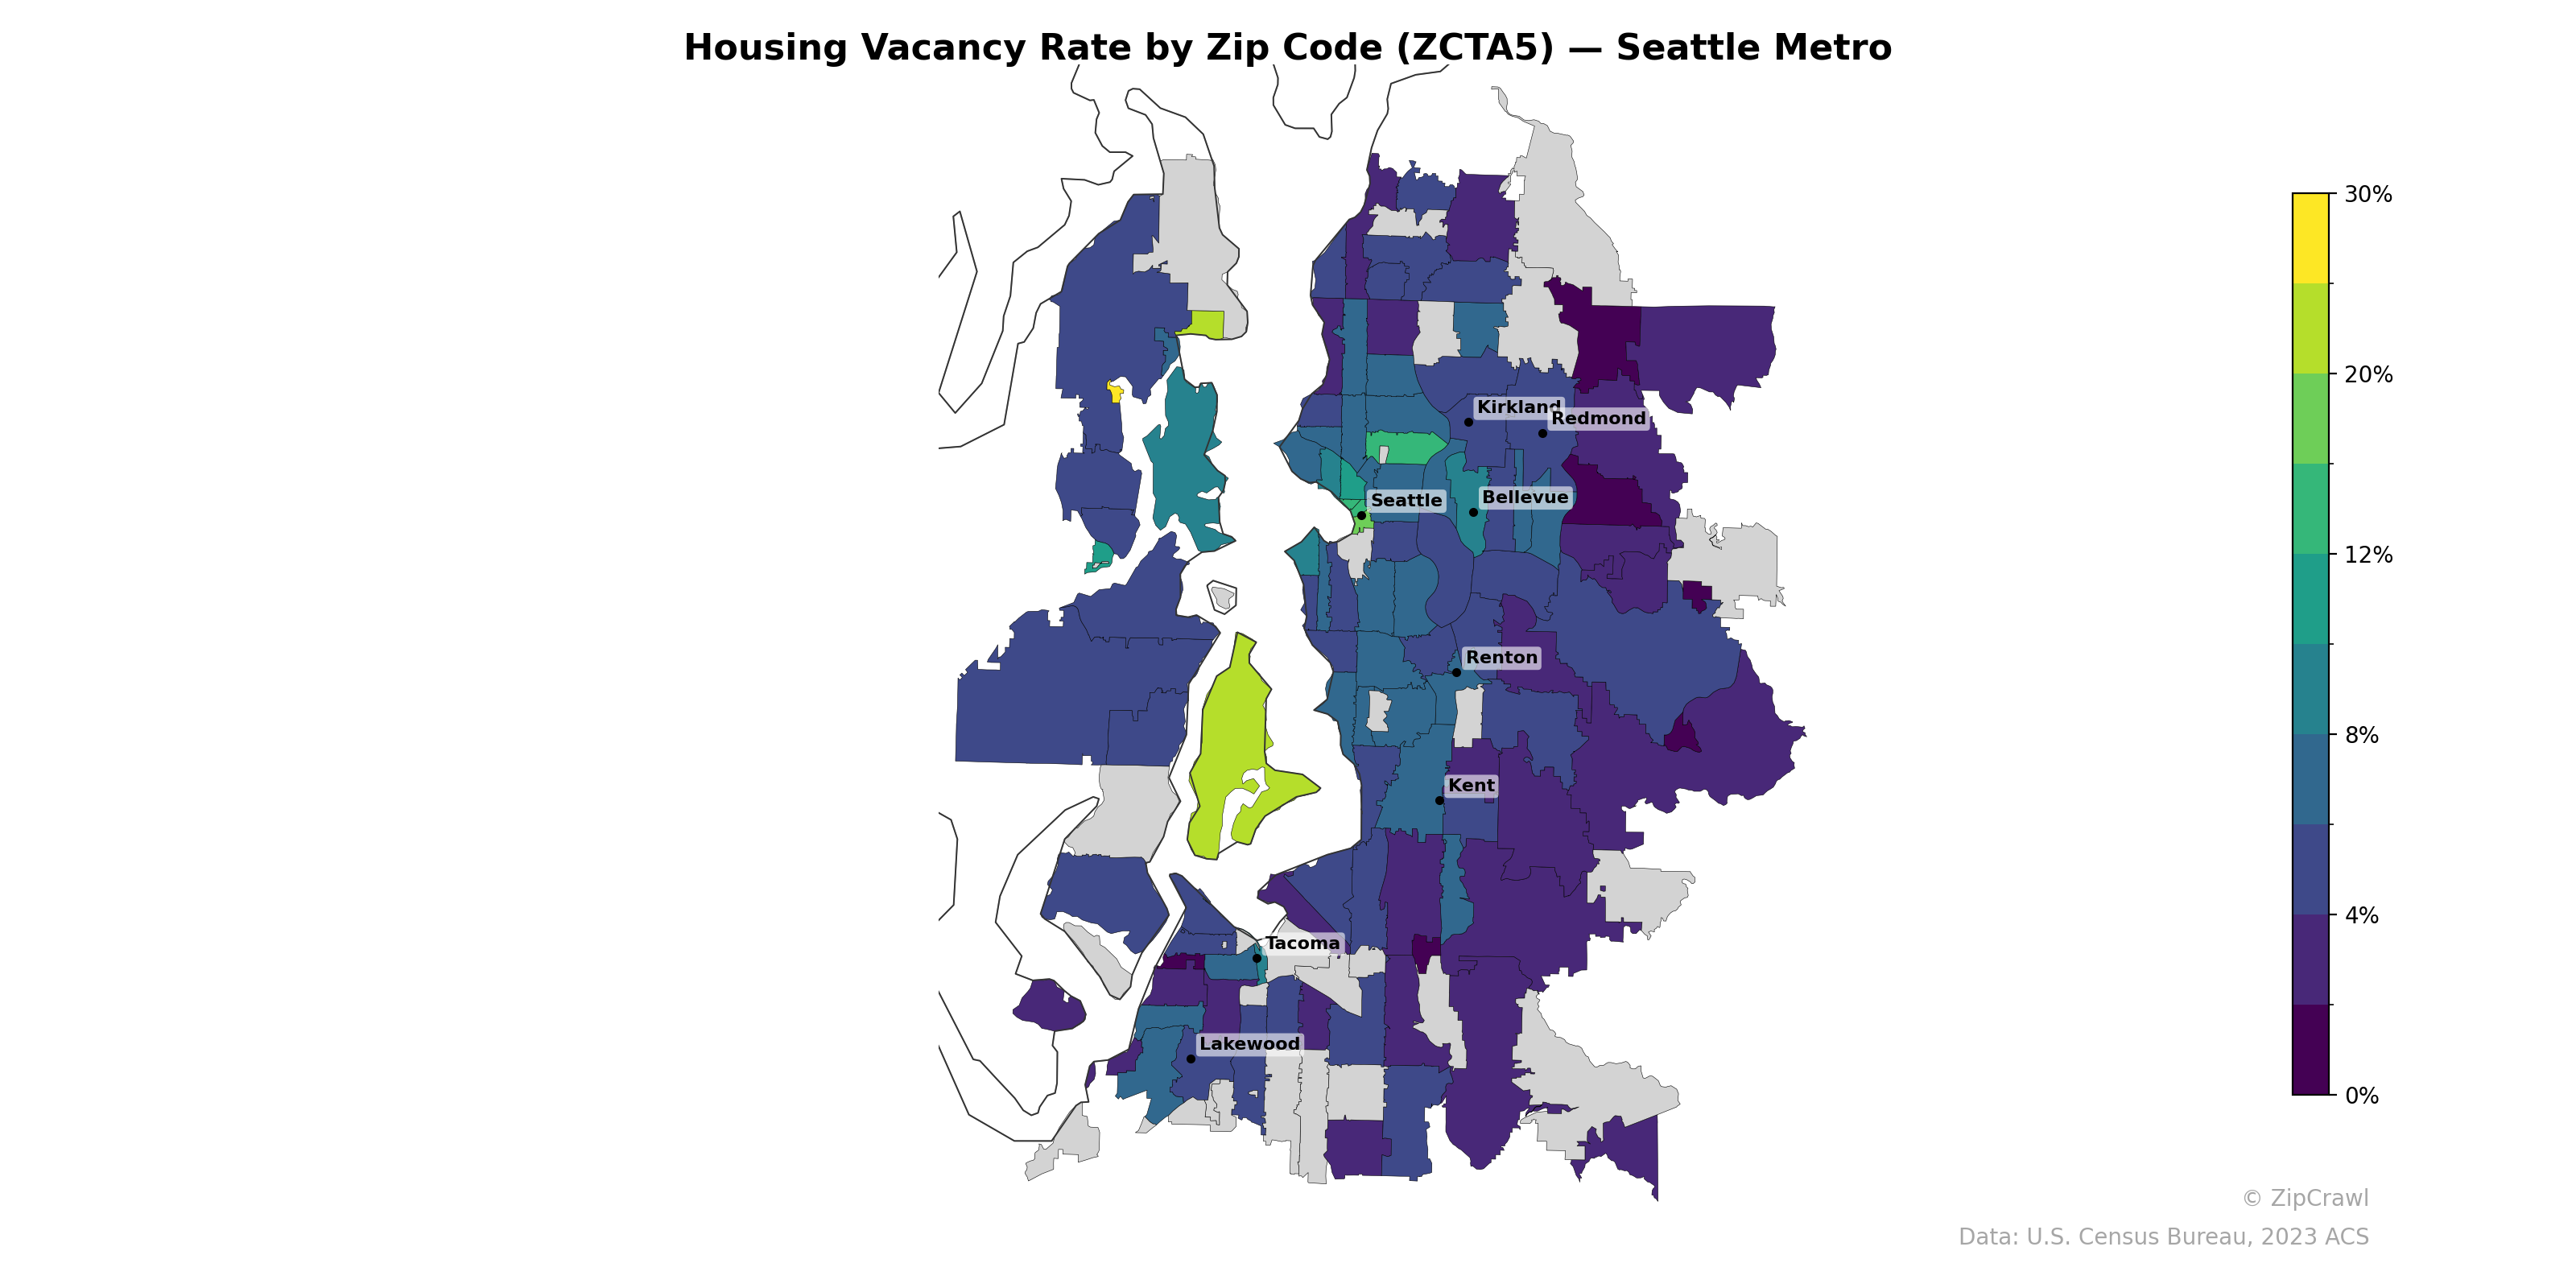
NOTE: Gray indicates insufficient data or a suppressed estimate.
Housing vacancy rates across the Seattle metro area are generally low, with most zip codes falling in the 4–8% range, though notable exceptions create a distinct geographic pattern. The highest vacancy rates (exceeding 20%) cluster in a corridor southwest of Renton and in isolated pockets near the northern shoreline areas, while the lowest rates (under 4%) concentrate heavily in the eastern suburbs around Bellevue, Redmond, and southeast King County. The core Seattle zip codes display moderate vacancy rates in the 6–12% range, contrasting sharply with the tighter housing markets in the Eastside communities.
Data: U.S. Census Bureau, 2023 ACS
Explore
- Population Non-Hispanic Black % by Zip Code (ZCTA5) — Chicago Metro
- Married Couple (% of all Households) by Zip Code (ZCTA5) — Seattle Metro
- Housing Owner-Occupied Median Value ($), by Zip Code (ZCTA5) — Seattle Metro
- % of Households with Broadband Internet, by Zip Code (ZCTA5) — Seattle Metro
- Household Average Size by Zip Code (ZCTA5) — Seattle Metro
- Housing Owner-Occupied % of Units, by Zip Code (ZCTA5) — Seattle Metro
- Housing Median Monthly Rent ($), by Zip Code (ZCTA5) — Seattle Metro
- Bachelor's Degree or Higher (% of Over 25) by Zip Code (ZCTA5) — Seattle Metro
- Housing % of Units Built Since 2010, by Zip Code (ZCTA5) — Seattle Metro
- % of Population without Health Insurance, by Zip Code (ZCTA5) — Seattle Metro
- % of Population without Health Insurance, by County
- U.S. Citizens (% of Population Over 18) by Zip Code (ZCTA5) — Chicago Metro
- % of Population on Food Stamps or SNAP (Last 12 Months), by Zip Code (ZCTA5) — Los Angeles Metro
- Household Median Income by Zip Code (ZCTA5) — Chicago Metro
- Population Non-Hispanic Asian % by Zip Code (ZCTA5) — Los Angeles Metro
- Median Age by Zip Code (ZCTA5) — Chicago Metro
- Population Hispanic % by Zip Code (ZCTA5) — Chicago Metro
- Population Non-Hispanic American Indian % by Zip Code (ZCTA5) — Chicago Metro
- Population Non-Hispanic White % by Zip Code (ZCTA5) — Chicago Metro
- High School Graduate (% of Over 25) by Zip Code (ZCTA5) — Chicago Metro
- % of Population without Health Insurance, by Zip Code (ZCTA5) — Boston Metro
- Bachelor's Degree or Higher (% of Over 25) by Zip Code (ZCTA5) — Boston Metro
- Housing Owner-Occupied % of Units, by Zip Code (ZCTA5) — Boston Metro
- Median Age by Zip Code (ZCTA5) — Boston Metro
- Household Median Income by Zip Code (ZCTA5) — Boston Metro
- Population Non-Hispanic White % by Zip Code (ZCTA5) — Boston Metro
- Population Non-Hispanic Black % by Zip Code (ZCTA5) — Boston Metro
- Population Non-Hispanic American Indian % by Zip Code (ZCTA5) — Boston Metro
- % of Households with Broadband Internet, by Zip Code (ZCTA5) — Boston Metro
- High School Graduate (% of Over 25) by Zip Code (ZCTA5) — Detroit Metro
- Housing Vacancy Rate by Zip Code (ZCTA5) — Houston Metro
- Housing Vacancy Rate by Zip Code (ZCTA5) — Miami Metro
- Housing Vacancy Rate by Zip Code (ZCTA5) — Detroit Metro
- Housing Vacancy Rate by Zip Code (ZCTA5) — Tampa Metro
- Housing Vacancy Rate by Zip Code (ZCTA5) — Boston Metro
- Housing Vacancy Rate by Zip Code (ZCTA5) — St. Louis Metro
- Housing Vacancy Rate by Zip Code (ZCTA5) — Chicago Metro
- Housing Vacancy Rate by Zip Code (ZCTA5) — Denver Metro
- Housing Vacancy Rate by Zip Code (ZCTA5) — Dallas Metro
- Housing Vacancy Rate by Zip Code (ZCTA5) — Austin Metro