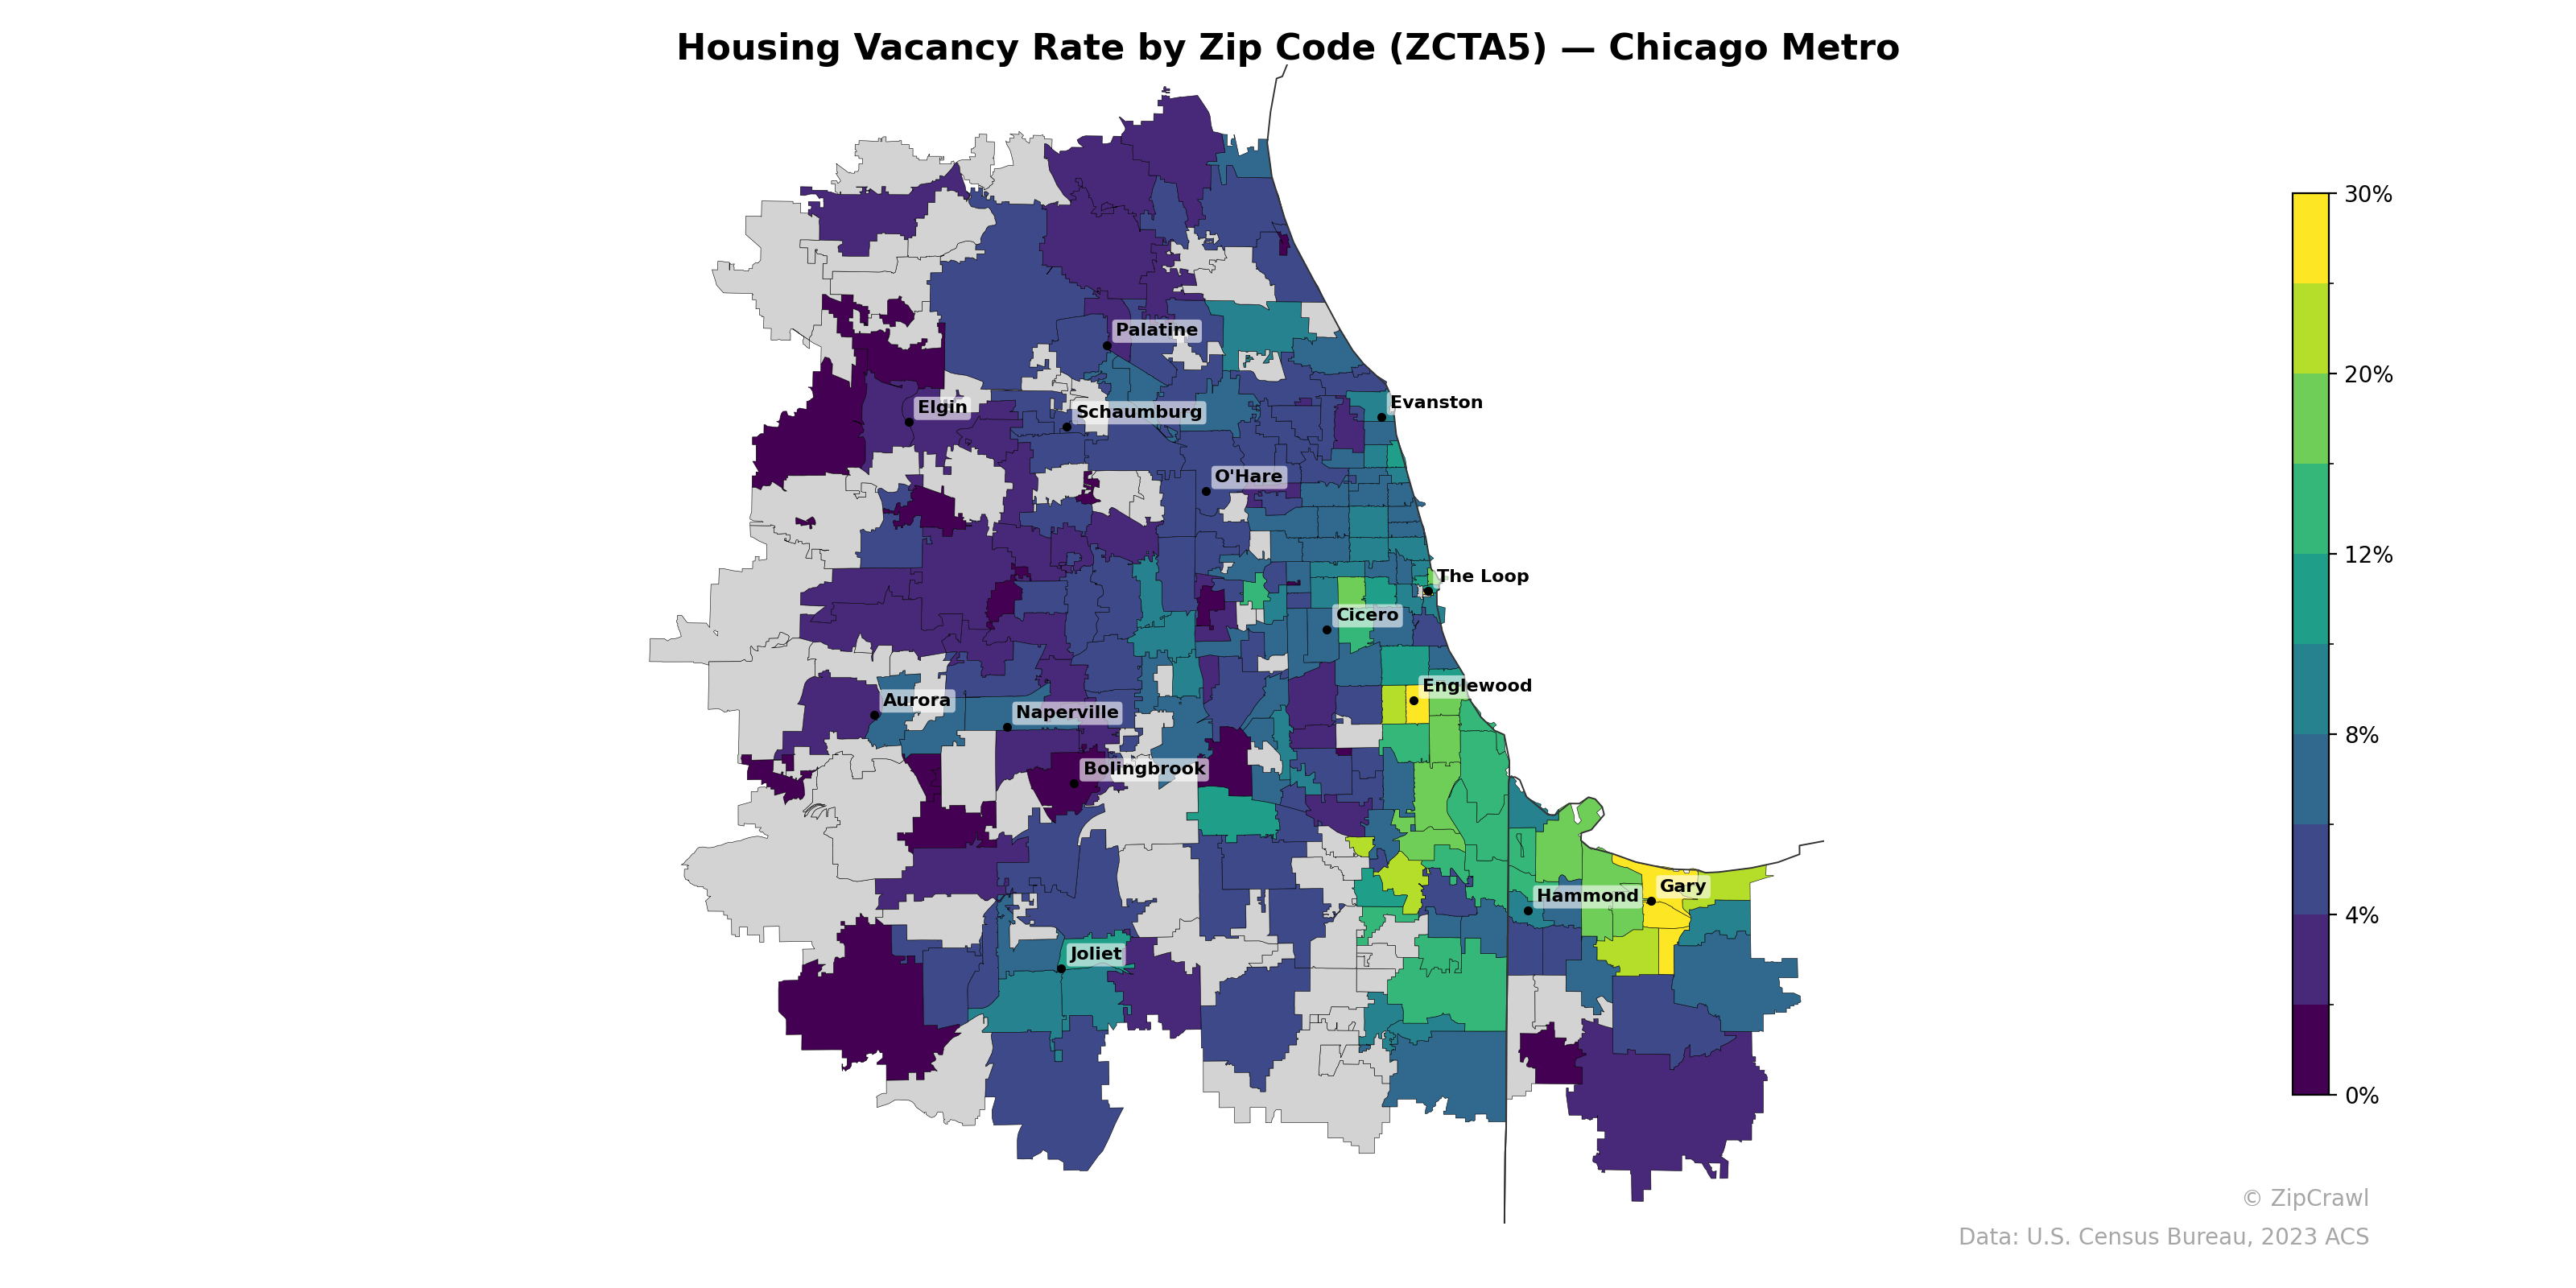
NOTE: Gray indicates insufficient data or a suppressed estimate.
Housing vacancy rates across the Chicago metro area exhibit a stark south-southeast gradient, with the highest concentrations (20–30%+) clustered in the south Chicago neighborhoods near Englewood and extending into Gary, Indiana, reflecting persistent population loss and disinvestment in these communities. By contrast, the western and northwestern suburbs—including Naperville, Schaumburg, and Palatine—maintain notably low vacancy rates below 4%, consistent with strong demand in these established residential corridors. The Loop and near-north lakefront zip codes display moderate vacancy levels (8–12%), likely driven by turnover in high-density rental and condo inventory rather than structural abandonment.
Data: U.S. Census Bureau, 2023 ACS
Explore
- Housing % of Units Built Since 2010, by Zip Code (ZCTA5) — Charlotte Metro
- % of Households with Broadband Internet, by Zip Code (ZCTA5) — Charlotte Metro
- Housing Median Monthly Rent ($), by Zip Code (ZCTA5) — Charlotte Metro
- Housing Owner-Occupied % of Units, by Zip Code (ZCTA5) — Charlotte Metro
- Married Couple (% of all Households) by Zip Code (ZCTA5) — Charlotte Metro
- Household Average Size by Zip Code (ZCTA5) — Charlotte Metro
- % of Population without Health Insurance, by Zip Code (ZCTA5) — Charlotte Metro
- Housing Owner-Occupied Median Value ($), by Zip Code (ZCTA5) — Charlotte Metro
- Bachelor's Degree or Higher (% of Over 25) by Zip Code (ZCTA5) — Charlotte Metro
- Population Non-Hispanic American Indian % by County
- Married Couple (% of all Households) by Zip Code (ZCTA5) — Chicago Metro
- Housing Owner-Occupied Median Value ($), by Zip Code (ZCTA5) — Chicago Metro
- Household Average Size by Zip Code (ZCTA5) — Chicago Metro
- Housing Owner-Occupied % of Units, by Zip Code (ZCTA5) — Chicago Metro
- Housing Median Monthly Rent ($), by Zip Code (ZCTA5) — Chicago Metro
- Bachelor's Degree or Higher (% of Over 25) by Zip Code (ZCTA5) — Chicago Metro
- Housing % of Units Built Since 2010, by Zip Code (ZCTA5) — Chicago Metro
- % of Households with Broadband Internet, by Zip Code (ZCTA5) — Chicago Metro
- % of Population without Health Insurance, by Zip Code (ZCTA5) — Chicago Metro
- Housing % of Units Built Since 2010, by Zip Code (ZCTA5) — Denver Metro
- Housing Owner-Occupied % of Units, by Zip Code (ZCTA5) — Denver Metro
- Household Average Size by Zip Code (ZCTA5) — Denver Metro
- Population Non-Hispanic American Indian % by Zip Code (ZCTA5) — Denver Metro
- Bachelor's Degree or Higher (% of Over 25) by Zip Code (ZCTA5) — Denver Metro
- Population Hispanic % by Zip Code (ZCTA5) — Denver Metro
- High School Graduate (% of Over 25) by Zip Code (ZCTA5) — Denver Metro
- Population Non-Hispanic White % by Zip Code (ZCTA5) — Denver Metro
- % of Population without Health Insurance, by Zip Code (ZCTA5) — Denver Metro
- Housing Owner-Occupied Median Value ($), by Zip Code (ZCTA5) — Denver Metro
- Population Non-Hispanic Black % by Zip Code (ZCTA5) — Denver Metro
- Housing Vacancy Rate by Zip Code (ZCTA5) — Houston Metro
- Housing Vacancy Rate by Zip Code (ZCTA5) — Miami Metro
- Housing Vacancy Rate by Zip Code (ZCTA5) — Charlotte Metro
- Housing Vacancy Rate by Zip Code (ZCTA5) — Detroit Metro
- Housing Vacancy Rate by Zip Code (ZCTA5) — Boston Metro
- Housing Vacancy Rate by Zip Code (ZCTA5) — Tampa Metro
- Housing Vacancy Rate by Zip Code (ZCTA5) — Dallas Metro
- Housing Vacancy Rate by Zip Code (ZCTA5) — Denver Metro
- Housing Vacancy Rate by Zip Code (ZCTA5) — Austin Metro
- Housing Vacancy Rate by Zip Code (ZCTA5) — San Diego Metro