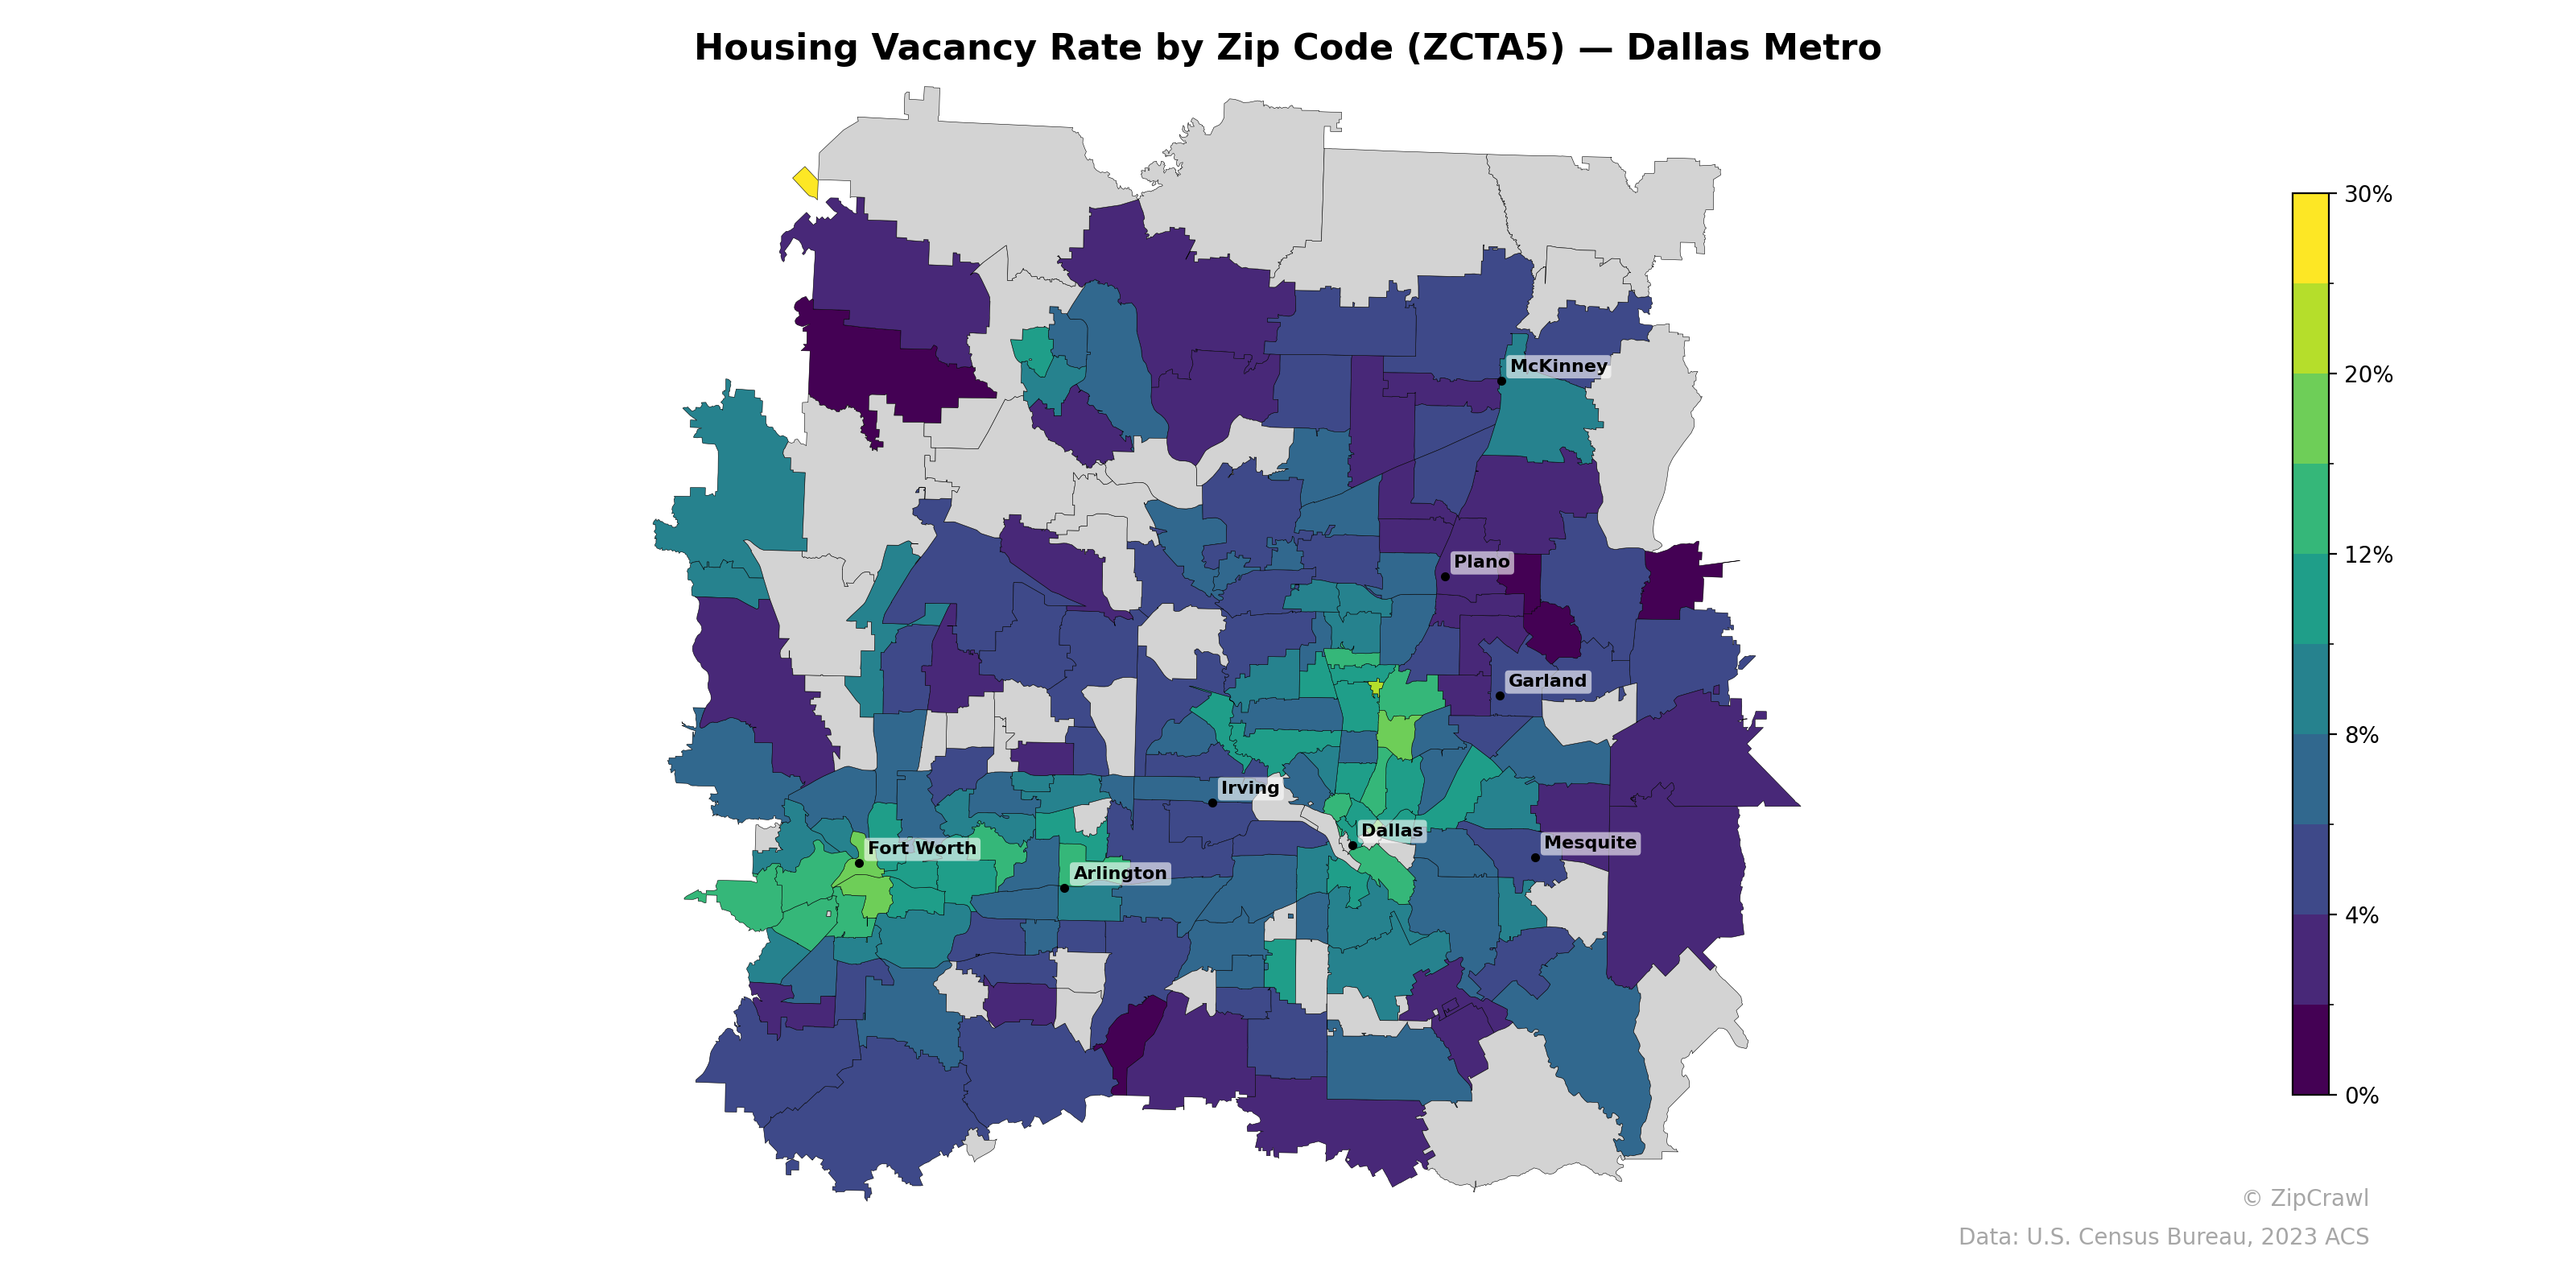
NOTE: Gray indicates insufficient data or a suppressed estimate.
Housing vacancy rates across the Dallas-Fort Worth metroplex generally range from 4% to 12%, with a notable outlier zip code in the far northwest corner exceeding 30%. The core urban areas of Dallas and Irving display a patchwork of moderate-to-high vacancy rates (8–16%), contrasting with lower vacancy clusters in suburban communities like McKinney, Plano, and portions of southern Fort Worth, where rates frequently fall below 4–6%. The western and southwestern portions of the metro, particularly around Arlington and south Fort Worth, exhibit considerable zip-code-level variability, suggesting localized differences in housing stock turnover and development activity.
Data: U.S. Census Bureau, 2023 ACS
Explore
- Population Hispanic % by Zip Code (ZCTA5) — New York Metro
- Married Couple (% of all Households) by Zip Code (ZCTA5) — Dallas Metro
- Housing Owner-Occupied % of Units, by Zip Code (ZCTA5) — Dallas Metro
- Housing Owner-Occupied Median Value ($), by Zip Code (ZCTA5) — Dallas Metro
- Household Average Size by Zip Code (ZCTA5) — Dallas Metro
- Housing % of Units Built Since 2010, by Zip Code (ZCTA5) — Dallas Metro
- Housing Median Monthly Rent ($), by Zip Code (ZCTA5) — Dallas Metro
- Bachelor's Degree or Higher (% of Over 25) by Zip Code (ZCTA5) — Dallas Metro
- % of Households with Broadband Internet, by Zip Code (ZCTA5) — Dallas Metro
- % of Population without Health Insurance, by Zip Code (ZCTA5) — Dallas Metro
- Population Non-Hispanic Black % by Zip Code (ZCTA5) — Nevada
- Median Age by County
- U.S. Citizens (% of Population Over 18) by Zip Code (ZCTA5) — New York Metro
- Population Non-Hispanic White % by Zip Code (ZCTA5) — New York Metro
- High School Graduate (% of Over 25) by Zip Code (ZCTA5) — New York Metro
- % of Population on Food Stamps or SNAP (Last 12 Months), by County
- Median Age by Zip Code (ZCTA5) — New York Metro
- Population Non-Hispanic Black % by Zip Code (ZCTA5) — New York Metro
- Bachelor's Degree or Higher (% of Over 25) by Zip Code (ZCTA5) — New York Metro
- Household Median Income by Zip Code (ZCTA5) — New York Metro
- Population Non-Hispanic American Indian % by Zip Code (ZCTA5) — New York Metro
- % of Population without Health Insurance, by Zip Code (ZCTA5) — Ohio
- Bachelor's Degree or Higher (% of Over 25) by Zip Code (ZCTA5) — Ohio
- Housing Owner-Occupied % of Units, by Zip Code (ZCTA5) — Ohio
- Population Non-Hispanic White % by Zip Code (ZCTA5) — Ohio
- Population Non-Hispanic Black % by Zip Code (ZCTA5) — Wisconsin
- Population Non-Hispanic American Indian % by Zip Code (ZCTA5) — Ohio
- High School Graduate (% of Over 25) by Zip Code (ZCTA5) — Ohio
- % of Households with Broadband Internet, by Zip Code (ZCTA5) — Ohio
- Population Hispanic % by Zip Code (ZCTA5) — Ohio
- Housing Vacancy Rate by Zip Code (ZCTA5) — Detroit Metro
- Housing Vacancy Rate by Zip Code (ZCTA5) — Houston Metro
- Housing Vacancy Rate by Zip Code (ZCTA5) — Denver Metro
- Housing Vacancy Rate by Zip Code (ZCTA5) — Miami Metro
- Housing Vacancy Rate by Zip Code (ZCTA5) — Tampa Metro
- Housing Vacancy Rate by Zip Code (ZCTA5) — Boston Metro
- Housing Vacancy Rate by Zip Code (ZCTA5) — Chicago Metro
- Housing Vacancy Rate by Zip Code (ZCTA5) — Austin Metro
- Housing Vacancy Rate by Zip Code (ZCTA5) — San Diego Metro
- Housing Vacancy Rate by Zip Code (ZCTA5) — Seattle Metro