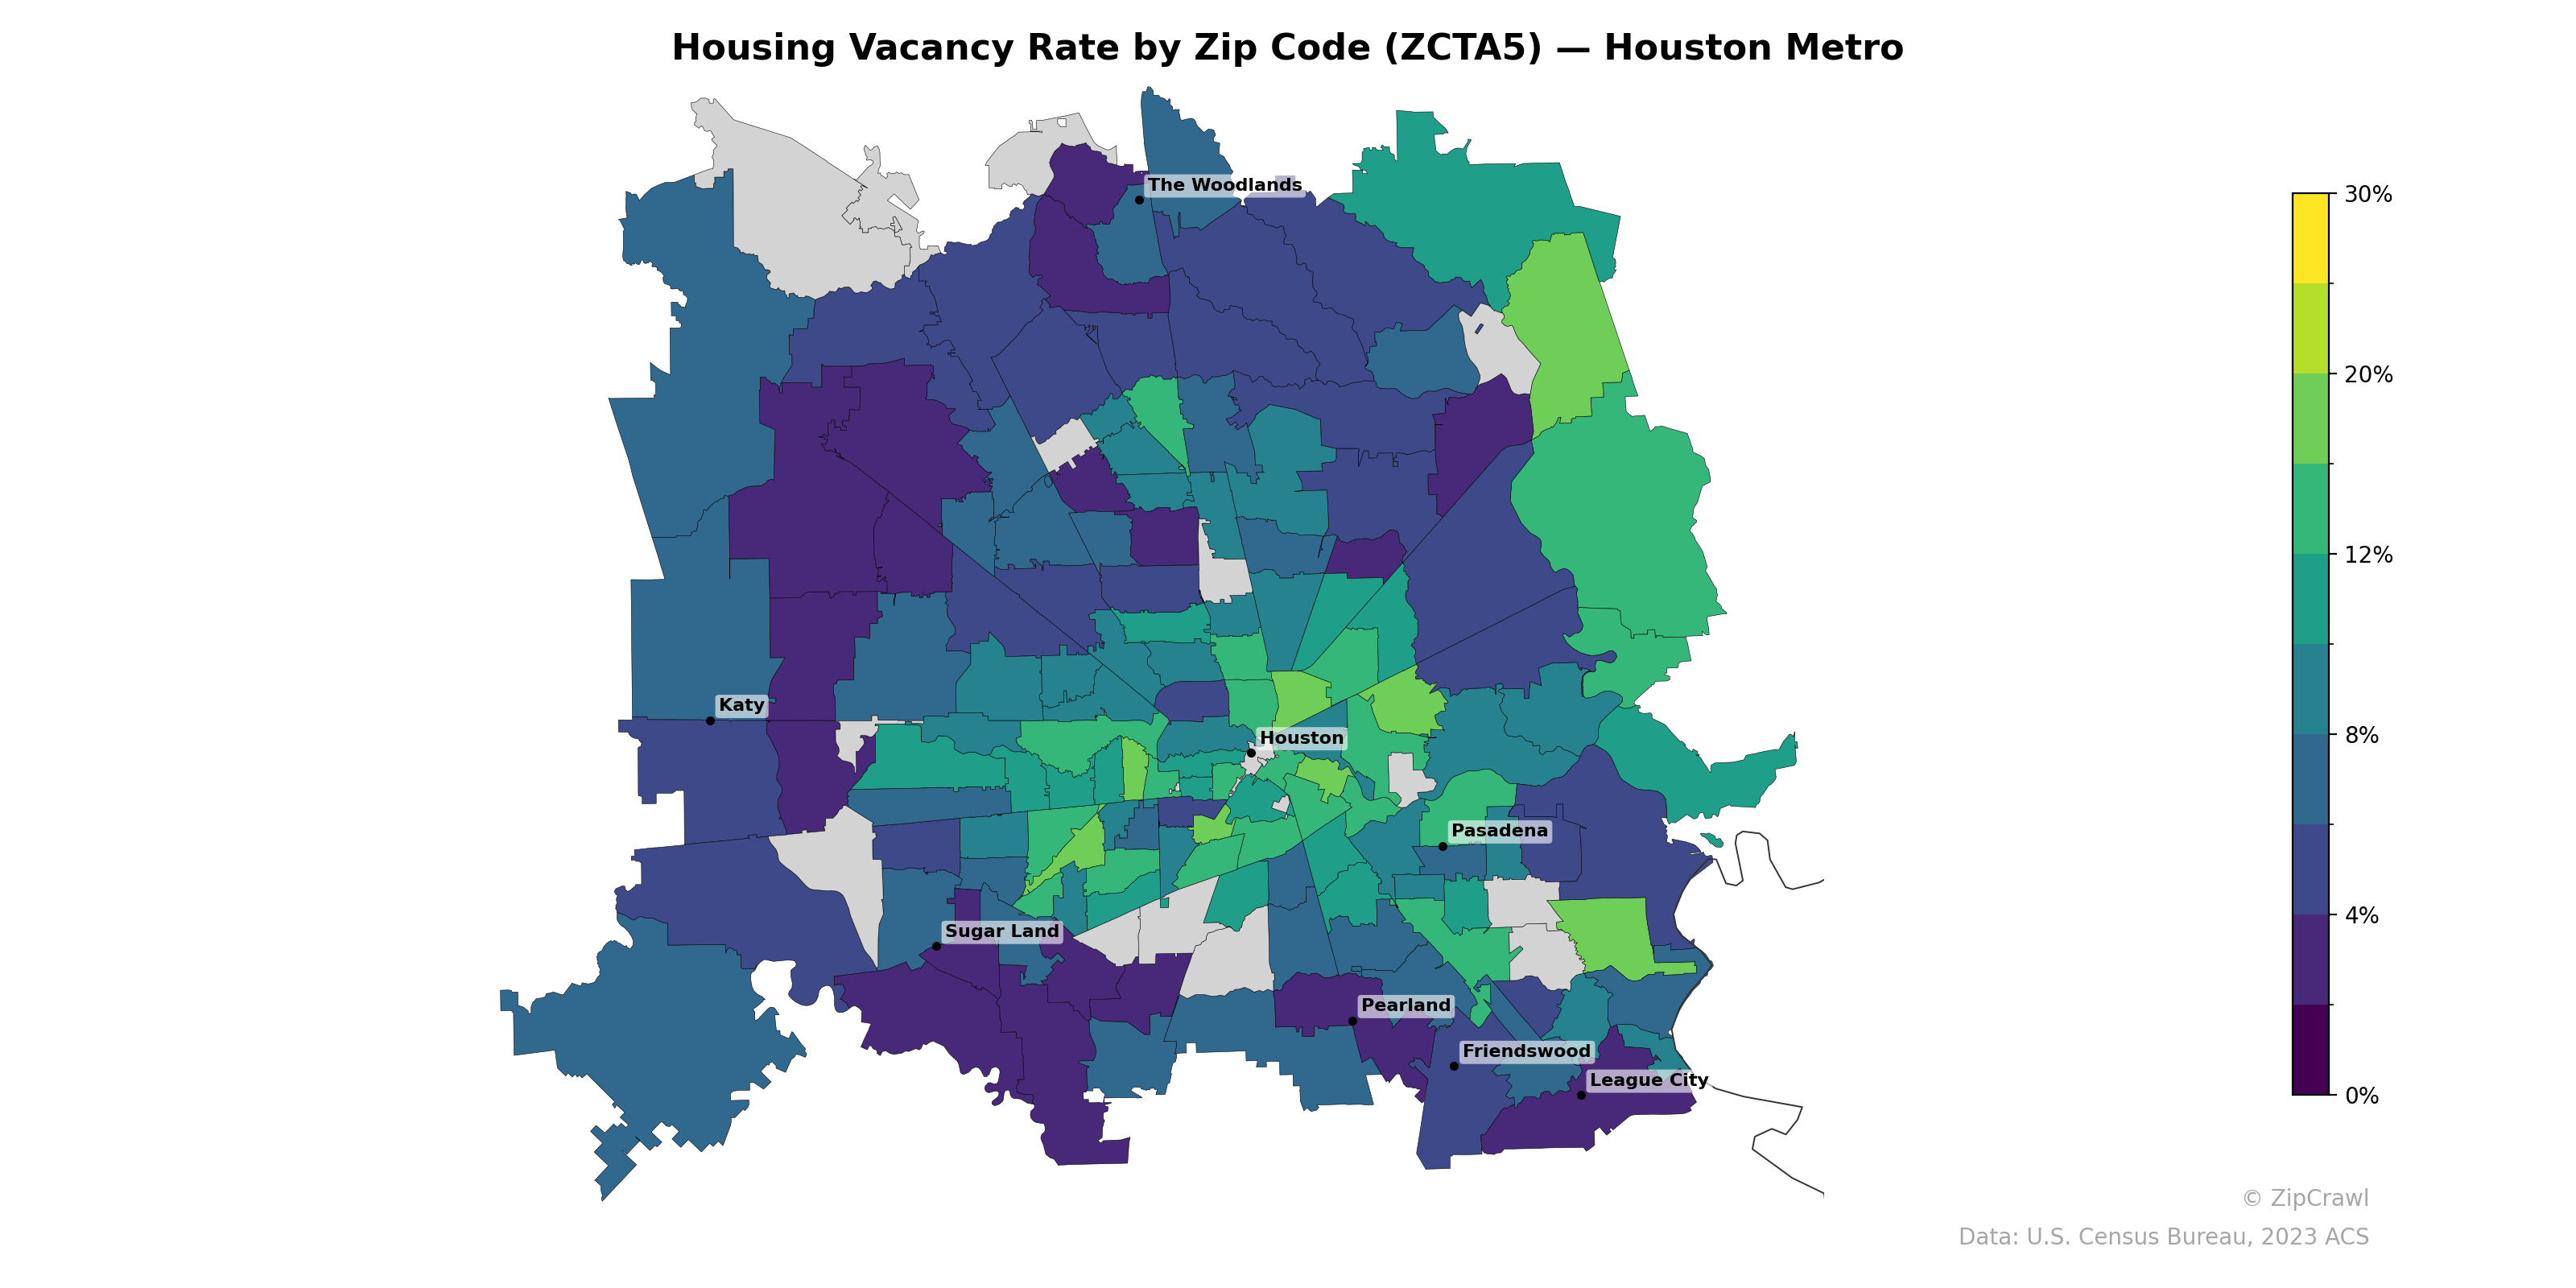
NOTE: Gray indicates insufficient data or a suppressed estimate.
Housing vacancy rates across the Houston metro exhibit a clear core-periphery gradient, with the highest concentrations (20–30%+) clustered in zip codes immediately surrounding downtown Houston and extending into the near-south and near-east sides, likely reflecting older multifamily stock and transitional neighborhoods. Suburban and exurban areas to the west toward Katy, northwest toward The Woodlands, and south toward League City and Friendswood generally maintain vacancy rates below 8%, consistent with newer, owner-occupied residential development. A notable pocket of elevated vacancy also appears in the far northeast quadrant of the metro, contrasting with the uniformly low rates found across the southwestern suburbs including Sugar Land and Pearland.
Data: U.S. Census Bureau, 2023 ACS
Explore
- Population Non-Hispanic American Indian % by Zip Code (ZCTA5) — New York Metro
- Married Couple (% of all Households) by Zip Code (ZCTA5) — Houston Metro
- Bachelor's Degree or Higher (% of Over 25) by Zip Code (ZCTA5) — Houston Metro
- Housing Owner-Occupied % of Units, by Zip Code (ZCTA5) — Houston Metro
- Household Average Size by Zip Code (ZCTA5) — Houston Metro
- Housing % of Units Built Since 2010, by Zip Code (ZCTA5) — Houston Metro
- Housing Owner-Occupied Median Value ($), by Zip Code (ZCTA5) — Houston Metro
- % of Households with Broadband Internet, by Zip Code (ZCTA5) — Houston Metro
- Housing Median Monthly Rent ($), by Zip Code (ZCTA5) — Houston Metro
- % of Population without Health Insurance, by Zip Code (ZCTA5) — Houston Metro
- Population Non-Hispanic Black % by Zip Code (ZCTA5) — Arkansas
- Median Age by County
- U.S. Citizens (% of Population Over 18) by Zip Code (ZCTA5) — New York Metro
- Population Hispanic % by Zip Code (ZCTA5) — New York Metro
- Population Non-Hispanic White % by Zip Code (ZCTA5) — New York Metro
- High School Graduate (% of Over 25) by Zip Code (ZCTA5) — New York Metro
- % of Population on Food Stamps or SNAP (Last 12 Months), by County
- Median Age by Zip Code (ZCTA5) — New York Metro
- Population Non-Hispanic Black % by Zip Code (ZCTA5) — New York Metro
- Bachelor's Degree or Higher (% of Over 25) by Zip Code (ZCTA5) — New York Metro
- Household Median Income by Zip Code (ZCTA5) — New York Metro
- % of Population without Health Insurance, by Zip Code (ZCTA5) — Ohio
- Bachelor's Degree or Higher (% of Over 25) by Zip Code (ZCTA5) — Ohio
- Housing Owner-Occupied % of Units, by Zip Code (ZCTA5) — Ohio
- Population Non-Hispanic White % by Zip Code (ZCTA5) — Ohio
- Median Age by Zip Code (ZCTA5) — Ohio
- Population Non-Hispanic American Indian % by Zip Code (ZCTA5) — Ohio
- High School Graduate (% of Over 25) by Zip Code (ZCTA5) — Ohio
- % of Households with Broadband Internet, by Zip Code (ZCTA5) — Ohio
- Population Hispanic % by Zip Code (ZCTA5) — Ohio
- Housing Vacancy Rate by Zip Code (ZCTA5) — Boston Metro
- Housing Vacancy Rate by Zip Code (ZCTA5) — Austin Metro
- Housing Vacancy Rate by Zip Code (ZCTA5) — Miami Metro
- Housing Vacancy Rate by Zip Code (ZCTA5) — Detroit Metro
- Housing Vacancy Rate by Zip Code (ZCTA5) — Tampa Metro
- Housing Vacancy Rate by Zip Code (ZCTA5) — Chicago Metro
- Housing Vacancy Rate by Zip Code (ZCTA5) — Denver Metro
- Housing Vacancy Rate by Zip Code (ZCTA5) — Dallas Metro
- Housing Vacancy Rate by Zip Code (ZCTA5) — Seattle Metro
- Housing Vacancy Rate by Zip Code (ZCTA5) — Atlanta Metro