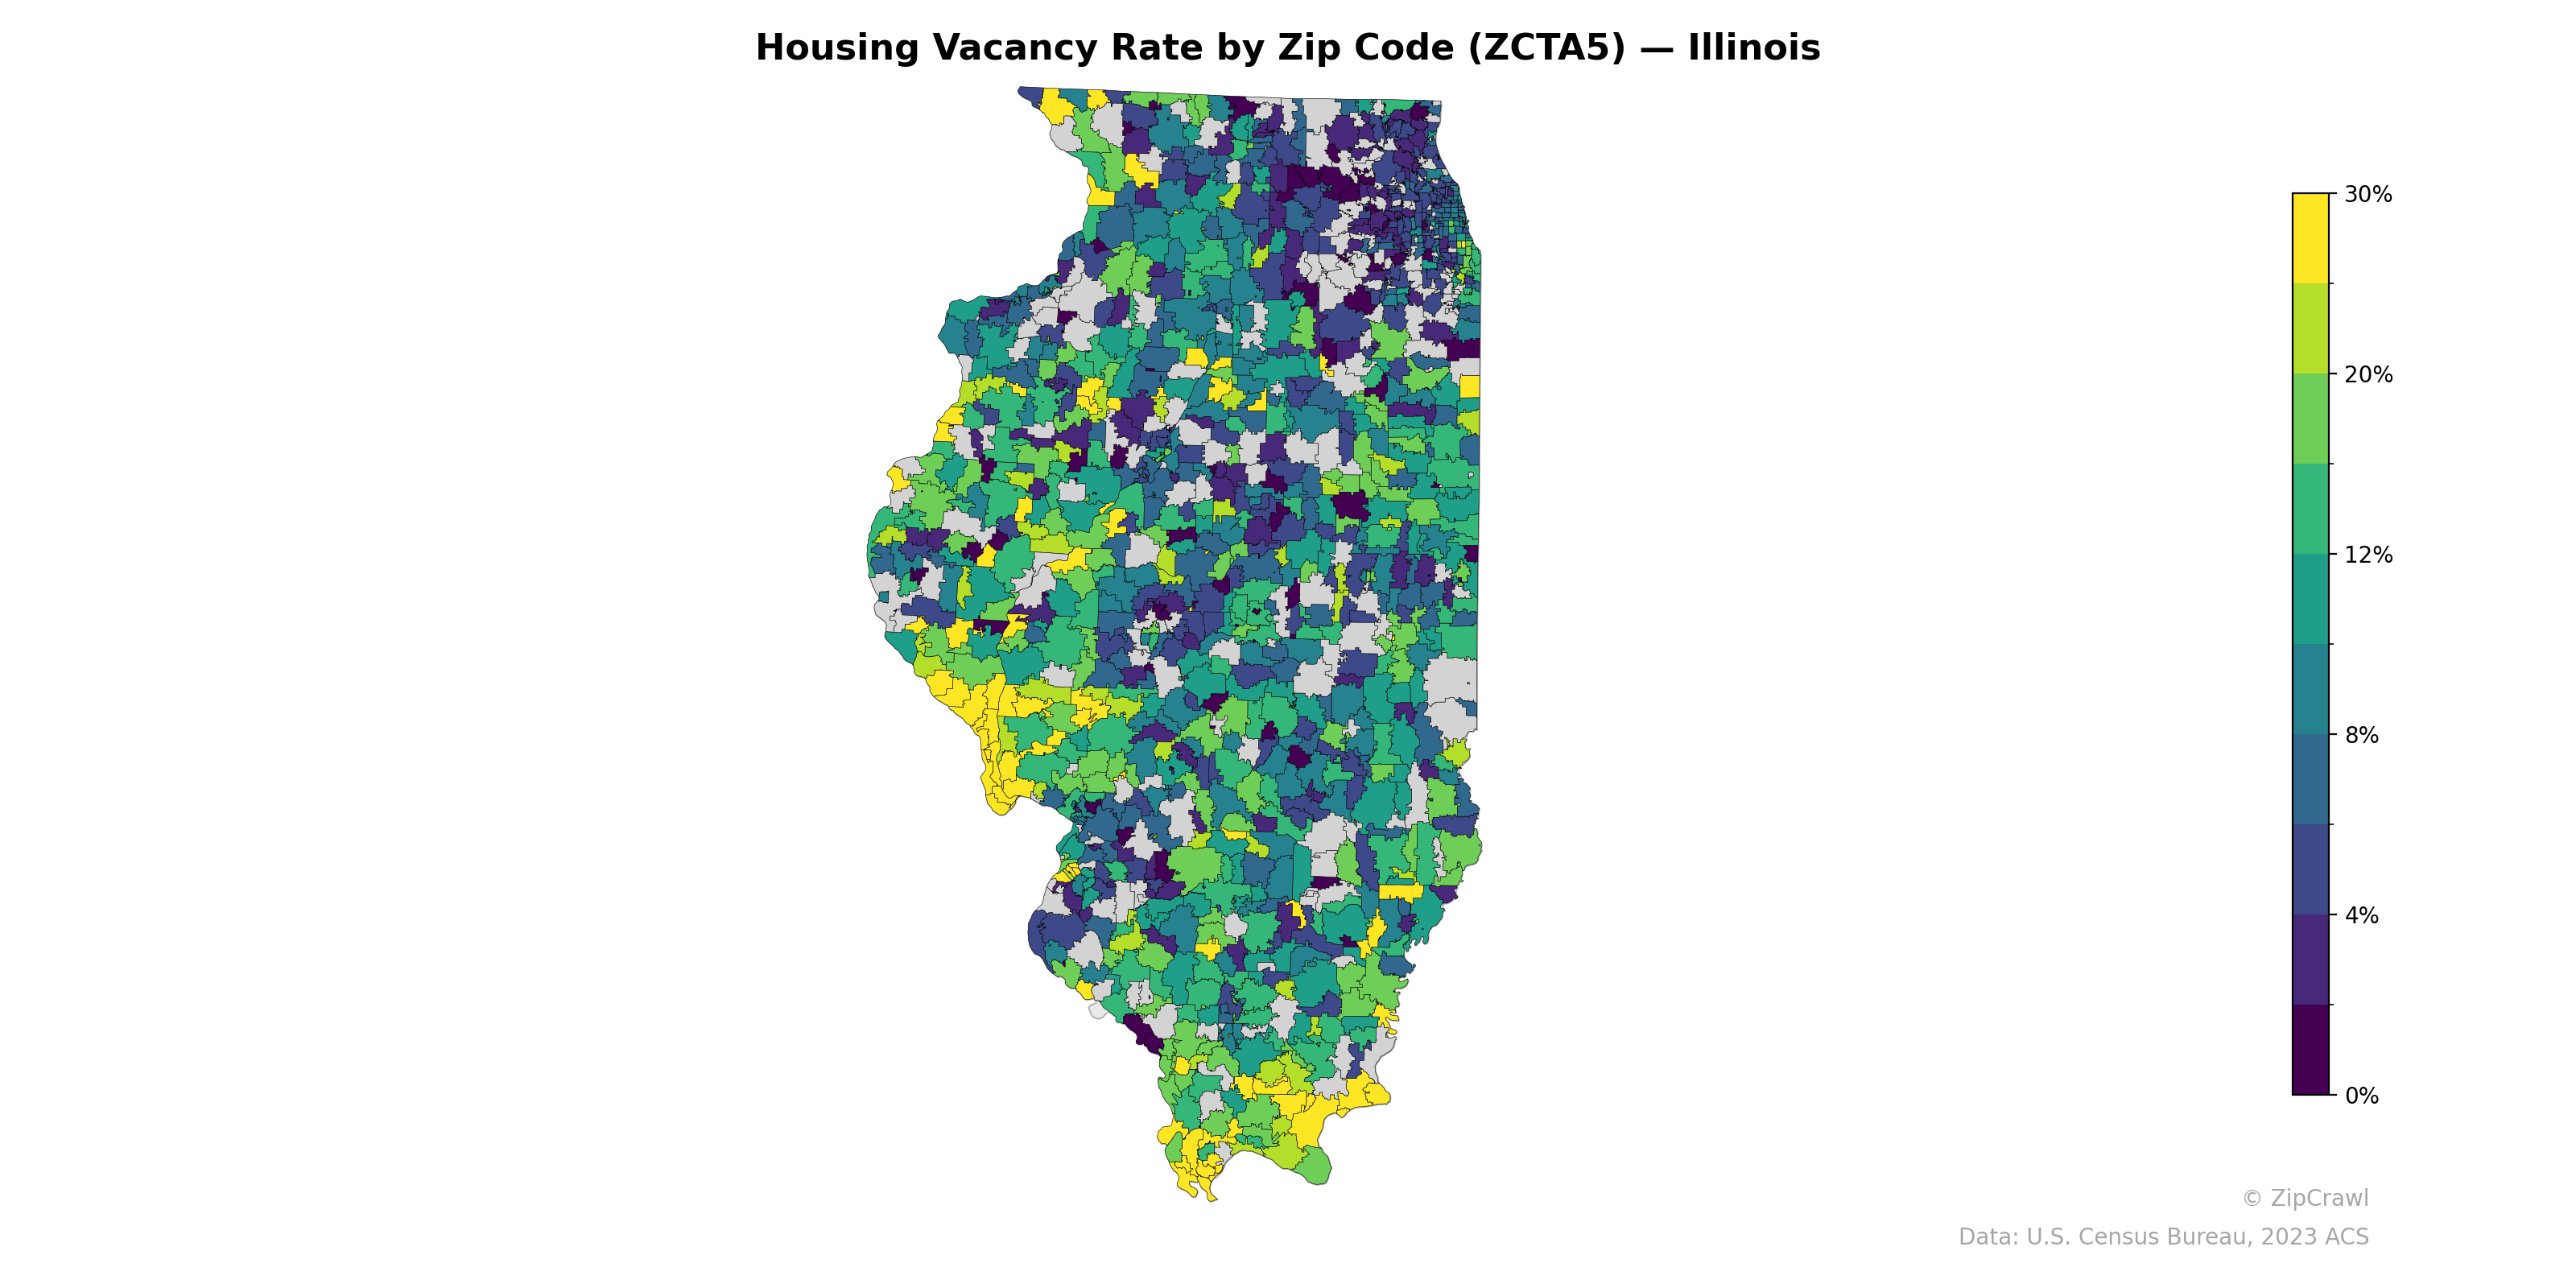
NOTE: Gray indicates insufficient data or a suppressed estimate.
The southern tip of Illinois exhibits notably elevated vacancy rates, with many zip codes exceeding 20–30%, consistent with long-term population decline in the Cairo and Shawnee National Forest region. The Chicago metropolitan area in the northeast displays stark internal contrasts, with some suburban zip codes registering near-zero vacancy alongside pockets of significantly higher rates, likely corresponding to areas of urban disinvestment on the city's south and west sides. Central Illinois generally clusters in the 8–12% range, though scattered rural zip codes with small housing stocks push noticeably higher, particularly along the western border near the Mississippi River corridor.
Data: U.S. Census Bureau, 2023 ACS
Explore
- Population Non-Hispanic Black % by Zip Code (ZCTA5) — Oklahoma
- Population Non-Hispanic Asian % by County
- % of Households with Broadband Internet, by Zip Code (ZCTA5) — Illinois
- Household Average Size by Zip Code (ZCTA5) — Illinois
- Housing Owner-Occupied Median Value ($), by Zip Code (ZCTA5) — Illinois
- Bachelor's Degree or Higher (% of Over 25) by Zip Code (ZCTA5) — Illinois
- Married Couple (% of all Households) by Zip Code (ZCTA5) — Illinois
- % of Population without Health Insurance, by Zip Code (ZCTA5) — Illinois
- Housing % of Units Built Since 2010, by Zip Code (ZCTA5) — Illinois
- Housing Median Monthly Rent ($), by Zip Code (ZCTA5) — Illinois
- Housing Owner-Occupied % of Units, by Zip Code (ZCTA5) — Illinois
- Population Non-Hispanic Black % by Zip Code (ZCTA5) — Idaho
- Population Non-Hispanic Black % by Zip Code (ZCTA5) — Montana
- Population Non-Hispanic Black % by Zip Code (ZCTA5) — Alaska
- Population Non-Hispanic Black % by Zip Code (ZCTA5) — Arkansas
- Household Median Income by County
- U.S. Citizens by County (% of Population Over 18)
- Household Average Size by County
- Housing Median Monthly Rent ($), by County
- Housing Owner-Occupied Median Value ($), by County
- Housing Owner-Occupied % of Units, by County
- % of Households with Broadband Internet, by County
- Housing % of Units Built Since 2010, by County
- Married Couple (% of all Households) by County
- Housing Owner-Occupied % of Units, by Zip Code (ZCTA5) — California
- Bachelor's Degree or Higher (% of Over 25) by Zip Code (ZCTA5) — California
- % of Population without Health Insurance, by Zip Code (ZCTA5) — California
- Housing Owner-Occupied Median Value ($), by Zip Code (ZCTA5) — California
- Population Non-Hispanic American Indian % by Zip Code (ZCTA5) — California
- High School Graduate (% of Over 25) by Zip Code (ZCTA5) — California
- Housing Vacancy Rate by Zip Code (ZCTA5) — Iowa
- Housing Vacancy Rate by Zip Code (ZCTA5) — Idaho
- Housing Vacancy Rate by Zip Code (ZCTA5) — Ohio
- Housing Vacancy Rate by Zip Code (ZCTA5) — Utah
- Housing Vacancy Rate by Zip Code (ZCTA5) — Indiana
- Housing Vacancy Rate by Zip Code (ZCTA5) — Maine
- Housing Vacancy Rate by Zip Code (ZCTA5) — Hawaii
- Housing Vacancy Rate by Zip Code (ZCTA5) — Wyoming
- Housing Vacancy Rate by Zip Code (ZCTA5) — Texas
- Housing Vacancy Rate by Zip Code (ZCTA5) — Nevada