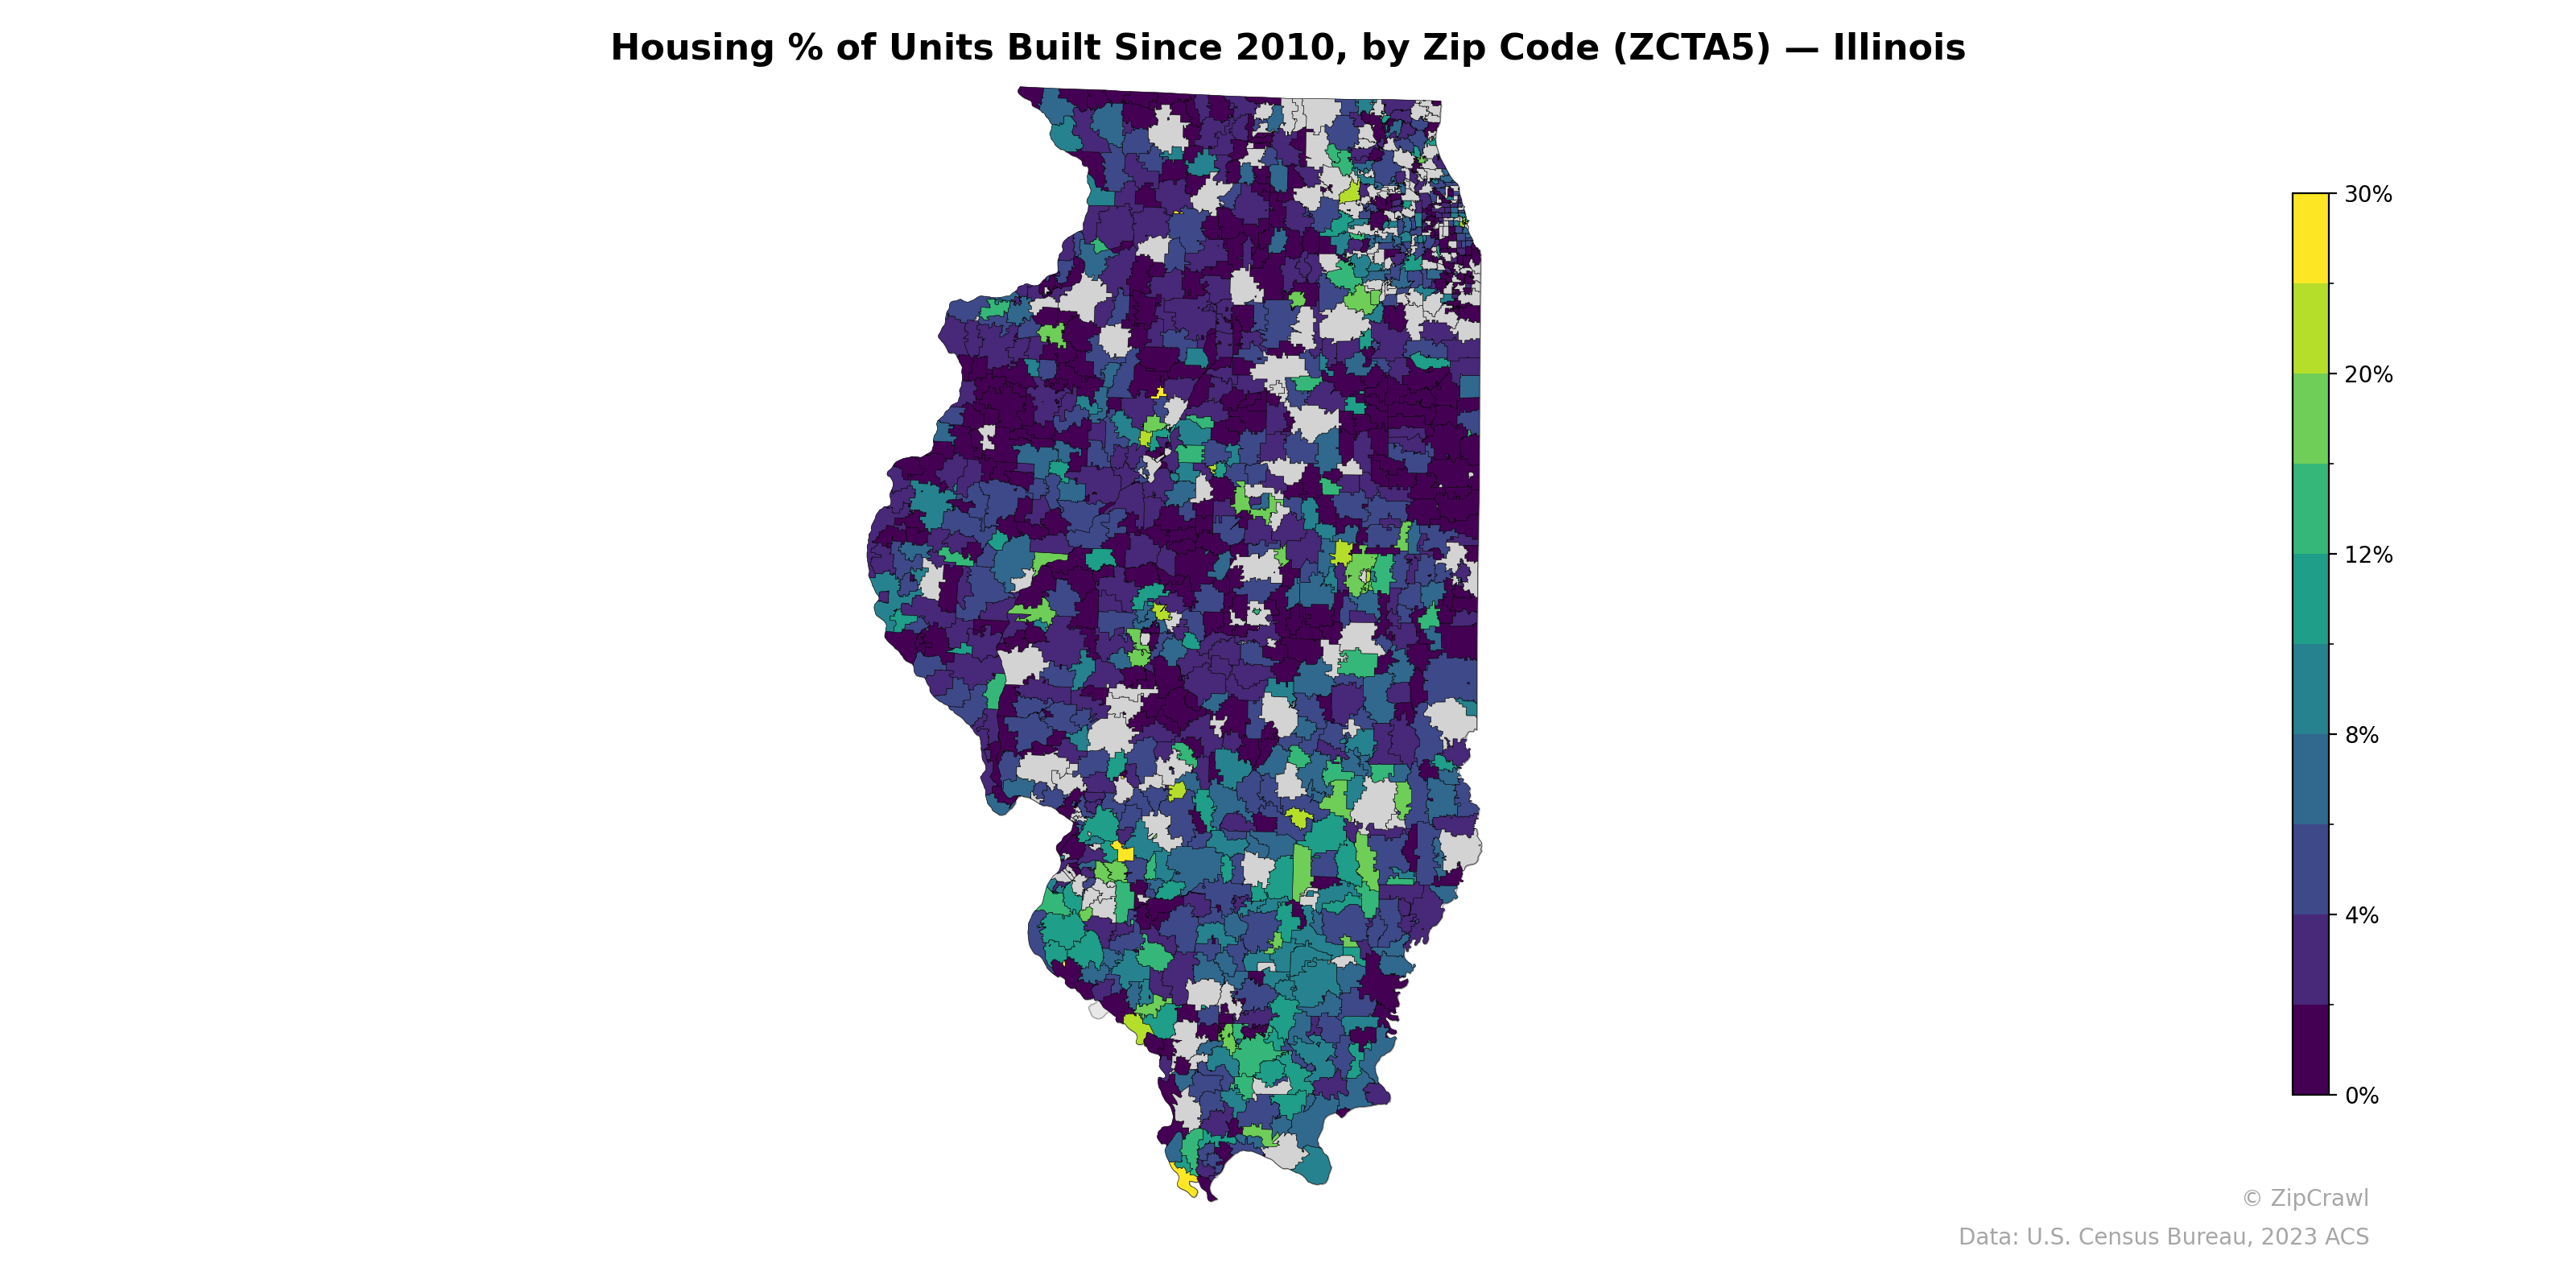
NOTE: Gray indicates insufficient data or a suppressed estimate.
The collar counties surrounding Chicago—particularly areas in Kendall, Will, and Kane counties—display notably higher shares of post-2010 housing construction, with several zip codes exceeding 20%, reflecting sustained suburban growth pressure on the metropolitan fringe. Central and southern Illinois zip codes are predominantly in the 0–4% range, indicating minimal new residential development, though scattered pockets of moderate construction (8–12%) appear near Springfield, Champaign-Urbana, and along the Metro East corridor adjacent to St. Louis. The starkest contrast exists between the deep purple zip codes of rural western Illinois, where virtually no new housing has been built, and the bright green and yellow clusters in exurban Chicago, underscoring the state's highly uneven distribution of residential growth.
Data: U.S. Census Bureau, 2023 ACS
Explore
- Median Age by Zip Code (ZCTA5) — Oklahoma
- Population Non-Hispanic Asian % by County
- % of Households with Broadband Internet, by Zip Code (ZCTA5) — Illinois
- Married Couple (% of all Households) by Zip Code (ZCTA5) — Illinois
- Housing Owner-Occupied Median Value ($), by Zip Code (ZCTA5) — Illinois
- Bachelor's Degree or Higher (% of Over 25) by Zip Code (ZCTA5) — Illinois
- Housing Vacancy Rate by Zip Code (ZCTA5) — Illinois
- % of Population without Health Insurance, by Zip Code (ZCTA5) — Illinois
- Household Average Size by Zip Code (ZCTA5) — Illinois
- Housing Median Monthly Rent ($), by Zip Code (ZCTA5) — Illinois
- Housing Owner-Occupied % of Units, by Zip Code (ZCTA5) — Illinois
- Median Age by Zip Code (ZCTA5) — Arkansas
- Median Age by Zip Code (ZCTA5) — Montana
- Median Age by Zip Code (ZCTA5) — Alaska
- Median Age by Zip Code (ZCTA5) — Idaho
- Household Median Income by County
- U.S. Citizens by County (% of Population Over 18)
- Household Average Size by County
- Housing Median Monthly Rent ($), by County
- Housing Owner-Occupied Median Value ($), by County
- Housing Owner-Occupied % of Units, by County
- % of Households with Broadband Internet, by County
- Housing Vacancy Rate by County
- Married Couple (% of all Households) by County
- % of Population without Health Insurance, by Zip Code (ZCTA5) — California
- Housing Median Monthly Rent ($), by Zip Code (ZCTA5) — California
- Bachelor's Degree or Higher (% of Over 25) by Zip Code (ZCTA5) — California
- Housing Owner-Occupied % of Units, by Zip Code (ZCTA5) — California
- Population Non-Hispanic Black % by Zip Code (ZCTA5) — California
- Population Non-Hispanic American Indian % by Zip Code (ZCTA5) — California
- Housing % of Units Built Since 2010, by Zip Code (ZCTA5) — Iowa
- Housing % of Units Built Since 2010, by Zip Code (ZCTA5) — Idaho
- Housing % of Units Built Since 2010, by Zip Code (ZCTA5) — Ohio
- Housing % of Units Built Since 2010, by Zip Code (ZCTA5) — Utah
- Housing % of Units Built Since 2010, by Zip Code (ZCTA5) — Indiana
- Housing % of Units Built Since 2010, by Zip Code (ZCTA5) — Hawaii
- Housing % of Units Built Since 2010, by Zip Code (ZCTA5) — Maine
- Housing % of Units Built Since 2010, by Zip Code (ZCTA5) — Oregon
- Housing % of Units Built Since 2010, by Zip Code (ZCTA5) — Texas
- Housing % of Units Built Since 2010, by Zip Code (ZCTA5) — Wyoming