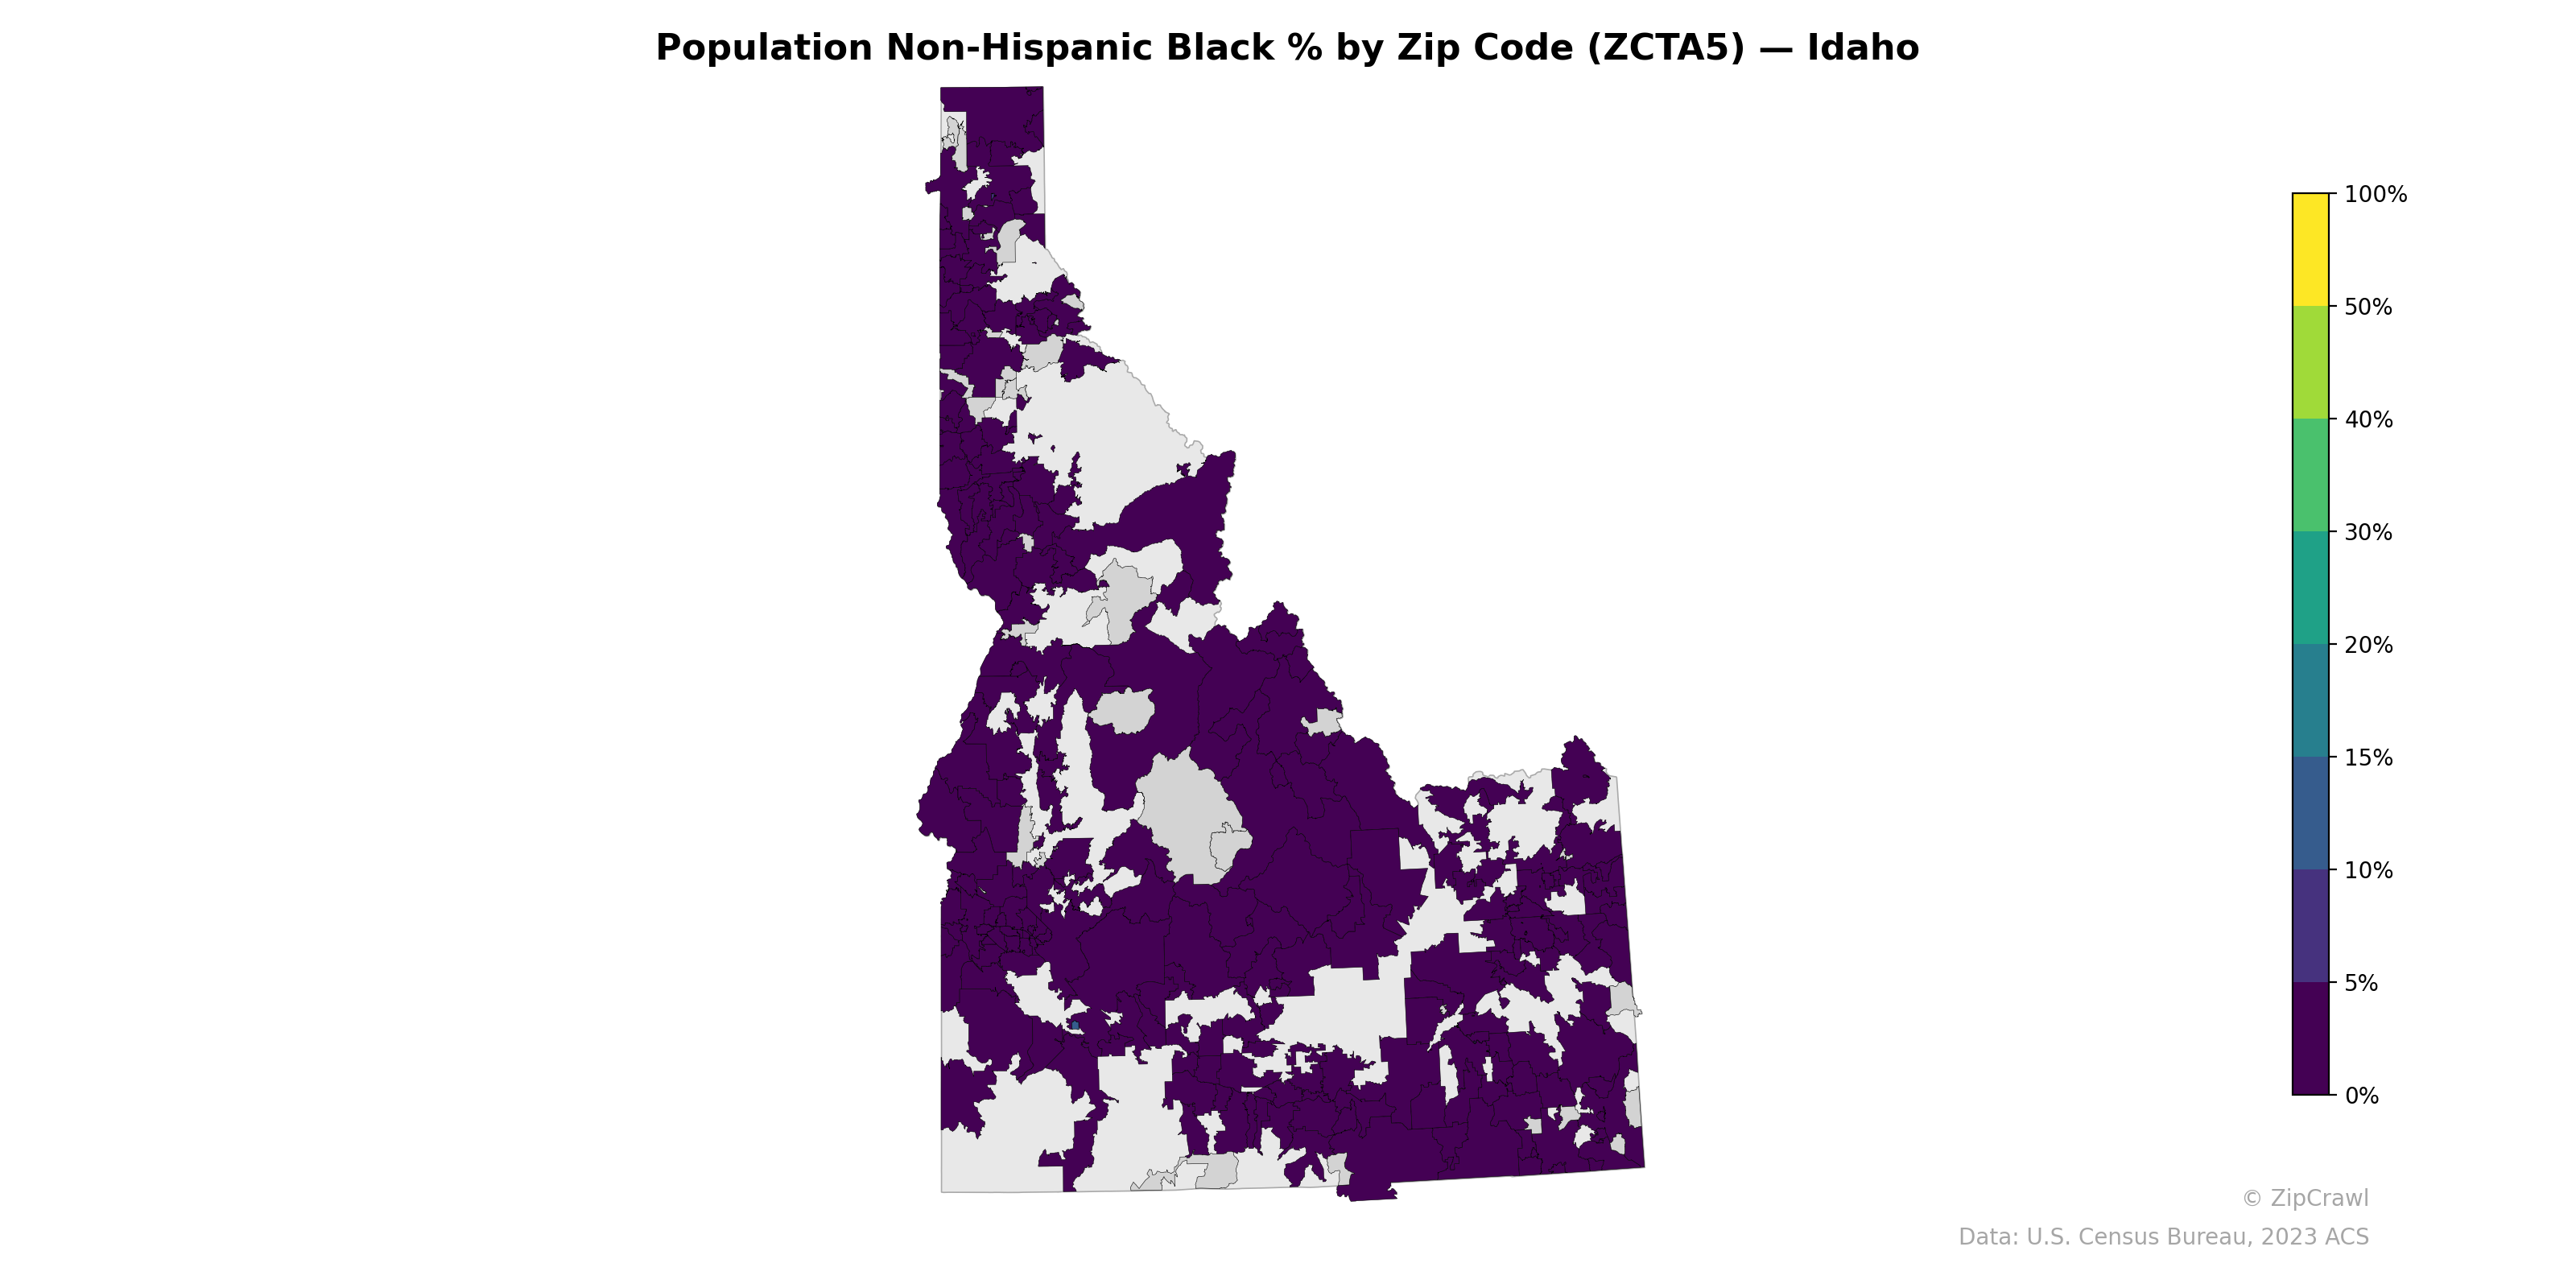
NOTE: Gray indicates insufficient data or a suppressed estimate.
Idaho's Non-Hispanic Black population percentage is uniformly very low across virtually all zip codes, with the overwhelming majority registering near 0% as indicated by the deep purple shading statewide. The gray (no data) areas scattered throughout the central mountainous regions and parts of northern Idaho likely correspond to sparsely populated or uninhabited zip codes. Even the Boise metropolitan area in the southwestern portion of the state, which would be expected to have the highest concentrations, shows no meaningfully elevated percentages relative to the color scale, underscoring Idaho's position as one of the least racially diverse states in the nation.
Data: U.S. Census Bureau, 2023 ACS
Explore
- Household Average Size by Zip Code (ZCTA5) — Florida
- Population Hispanic % by Zip Code (ZCTA5) — Idaho
- Household Median Income by Zip Code (ZCTA5) — Idaho
- Population Non-Hispanic Asian % by Zip Code (ZCTA5) — Nebraska
- Married Couple (% of all Households) by Zip Code (ZCTA5) — Nebraska
- % of Population on Food Stamps or SNAP (Last 12 Months), by Zip Code (ZCTA5) — Nebraska
- Population Non-Hispanic White % by Zip Code (ZCTA5) — Idaho
- U.S. Citizens (% of Population Over 18) by Zip Code (ZCTA5) — Idaho
- Median Age by Zip Code (ZCTA5) — Idaho
- Housing Vacancy Rate by Zip Code (ZCTA5) — Nebraska
- Housing Median Monthly Rent ($), by County
- Housing Vacancy Rate by Zip Code (ZCTA5) — Illinois
- Housing Vacancy Rate by Zip Code (ZCTA5) — Florida
- Married Couple (% of all Households) by Zip Code (ZCTA5) — Florida
- Housing Vacancy Rate by Zip Code (ZCTA5) — Washington D.C. Metro
- Housing Owner-Occupied Median Value ($), by Zip Code (ZCTA5) — Florida
- % of Population without Health Insurance, by Zip Code (ZCTA5) — Florida
- Housing Median Monthly Rent ($), by Zip Code (ZCTA5) — Florida
- Bachelor's Degree or Higher (% of Over 25) by Zip Code (ZCTA5) — Florida
- % of Households with Broadband Internet, by Zip Code (ZCTA5) — Florida
- Housing % of Units Built Since 2010, by Zip Code (ZCTA5) — Florida
- Housing Owner-Occupied % of Units, by Zip Code (ZCTA5) — Florida
- Housing Vacancy Rate by Zip Code (ZCTA5) — Mississippi
- Bachelor's Degree or Higher (% of Over 25) by Zip Code (ZCTA5) — Mississippi
- Population Non-Hispanic Asian % by Zip Code (ZCTA5) — Mississippi
- % of Households with Broadband Internet, by Zip Code (ZCTA5) — Mississippi
- Population Non-Hispanic American Indian % by Zip Code (ZCTA5) — Mississippi
- Married Couple (% of all Households) by Zip Code (ZCTA5) — Mississippi
- High School Graduate (% of Over 25) by Zip Code (ZCTA5) — Mississippi
- % of Population on Food Stamps or SNAP (Last 12 Months), by Zip Code (ZCTA5) — Mississippi
- Population Non-Hispanic Black % by Zip Code (ZCTA5) — Iowa
- Population Non-Hispanic Black % by Zip Code (ZCTA5) — Utah
- Population Non-Hispanic Black % by Zip Code (ZCTA5) — Ohio
- Population Non-Hispanic Black % by Zip Code (ZCTA5) — Florida
- Population Non-Hispanic Black % by Zip Code (ZCTA5) — Indiana
- Population Non-Hispanic Black % by Zip Code (ZCTA5) — Nevada
- Population Non-Hispanic Black % by Zip Code (ZCTA5) — Texas
- Population Non-Hispanic Black % by Zip Code (ZCTA5) — Oregon
- Population Non-Hispanic Black % by Zip Code (ZCTA5) — Hawaii
- Population Non-Hispanic Black % by Zip Code (ZCTA5) — Maine