NOTE: Gray indicates insufficient data or a suppressed estimate.
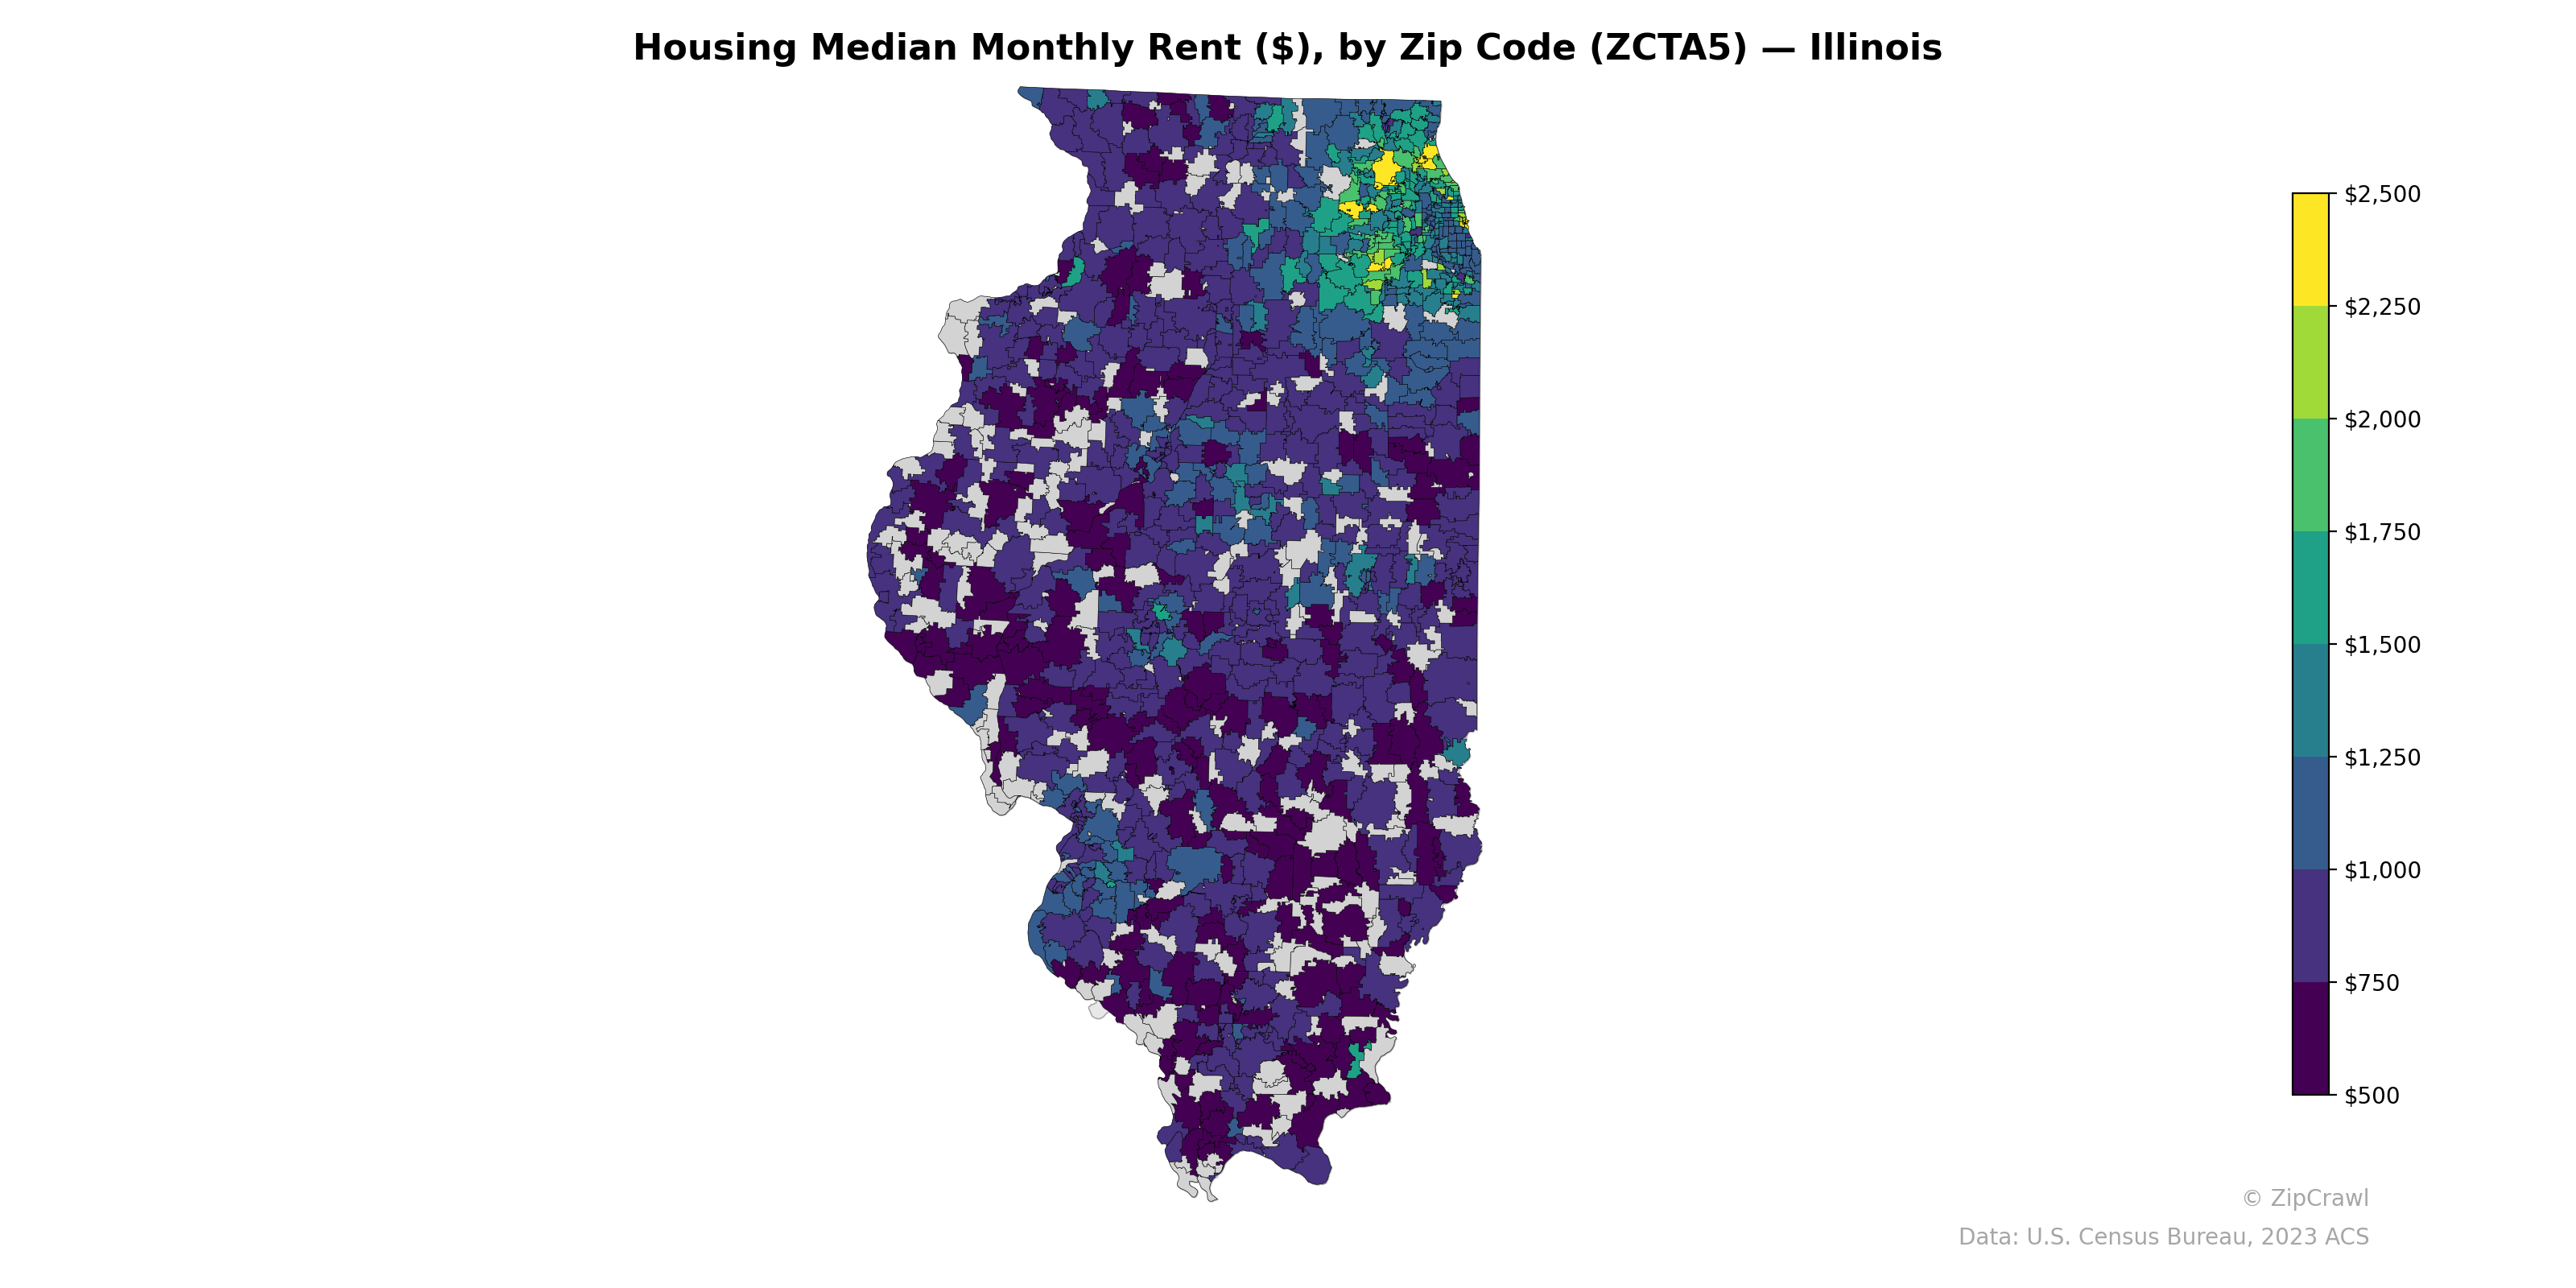
The Chicago metropolitan area in the northeastern corner of the state dominates the high end of the rent spectrum, with several zip codes exceeding $2,000–$2,500 per month, while surrounding suburban areas display a gradient stepping down through the $1,250–$1,750 range. Central and southern Illinois zip codes are predominantly in the $500–$750 range, with scattered pockets of moderately higher rents near university towns and regional centers such as Champaign-Urbana and Springfield. The starkest contrast exists between the affluent North Shore suburbs along Lake Michigan and the deeply rural southern third of the state, where median rents in some zip codes fall below $500.
Data: U.S. Census Bureau, 2023 ACS
Explore
- Household Median Income by Zip Code (ZCTA5) — Oklahoma
- Population Non-Hispanic Asian % by County
- % of Households with Broadband Internet, by Zip Code (ZCTA5) — Illinois
- Married Couple (% of all Households) by Zip Code (ZCTA5) — Illinois
- Housing Owner-Occupied Median Value ($), by Zip Code (ZCTA5) — Illinois
- Bachelor's Degree or Higher (% of Over 25) by Zip Code (ZCTA5) — Illinois
- Housing Vacancy Rate by Zip Code (ZCTA5) — Illinois
- % of Population without Health Insurance, by Zip Code (ZCTA5) — Illinois
- Household Average Size by Zip Code (ZCTA5) — Illinois
- Housing % of Units Built Since 2010, by Zip Code (ZCTA5) — Illinois
- Housing Owner-Occupied % of Units, by Zip Code (ZCTA5) — Illinois
- Household Median Income by Zip Code (ZCTA5) — Idaho
- Household Median Income by Zip Code (ZCTA5) — Montana
- Household Median Income by Zip Code (ZCTA5) — Alaska
- Household Median Income by Zip Code (ZCTA5) — Arkansas
- Household Median Income by County
- Household Average Size by County
- Married Couple (% of all Households) by County
- U.S. Citizens by County (% of Population Over 18)
- Housing Owner-Occupied Median Value ($), by County
- Housing Owner-Occupied % of Units, by County
- % of Households with Broadband Internet, by County
- Housing Vacancy Rate by County
- Housing % of Units Built Since 2010, by County
- Housing Owner-Occupied Median Value ($), by Zip Code (ZCTA5) — California
- % of Population without Health Insurance, by Zip Code (ZCTA5) — California
- Housing Owner-Occupied % of Units, by Zip Code (ZCTA5) — California
- Housing % of Units Built Since 2010, by Zip Code (ZCTA5) — California
- Population Non-Hispanic American Indian % by Zip Code (ZCTA5) — California
- High School Graduate (% of Over 25) by Zip Code (ZCTA5) — California
- Housing Median Monthly Rent ($), by Zip Code (ZCTA5) — Iowa
- Housing Median Monthly Rent ($), by Zip Code (ZCTA5) — Indiana
- Housing Median Monthly Rent ($), by Zip Code (ZCTA5) — Idaho
- Housing Median Monthly Rent ($), by Zip Code (ZCTA5) — Montana
- Housing Median Monthly Rent ($), by Zip Code (ZCTA5) — Ohio
- Housing Median Monthly Rent ($), by Zip Code (ZCTA5) — Vermont
- Housing Median Monthly Rent ($), by Zip Code (ZCTA5) — Maine
- Housing Median Monthly Rent ($), by Zip Code (ZCTA5) — Utah
- Housing Median Monthly Rent ($), by Zip Code (ZCTA5) — Hawaii
- Housing Median Monthly Rent ($), by Zip Code (ZCTA5) — Texas