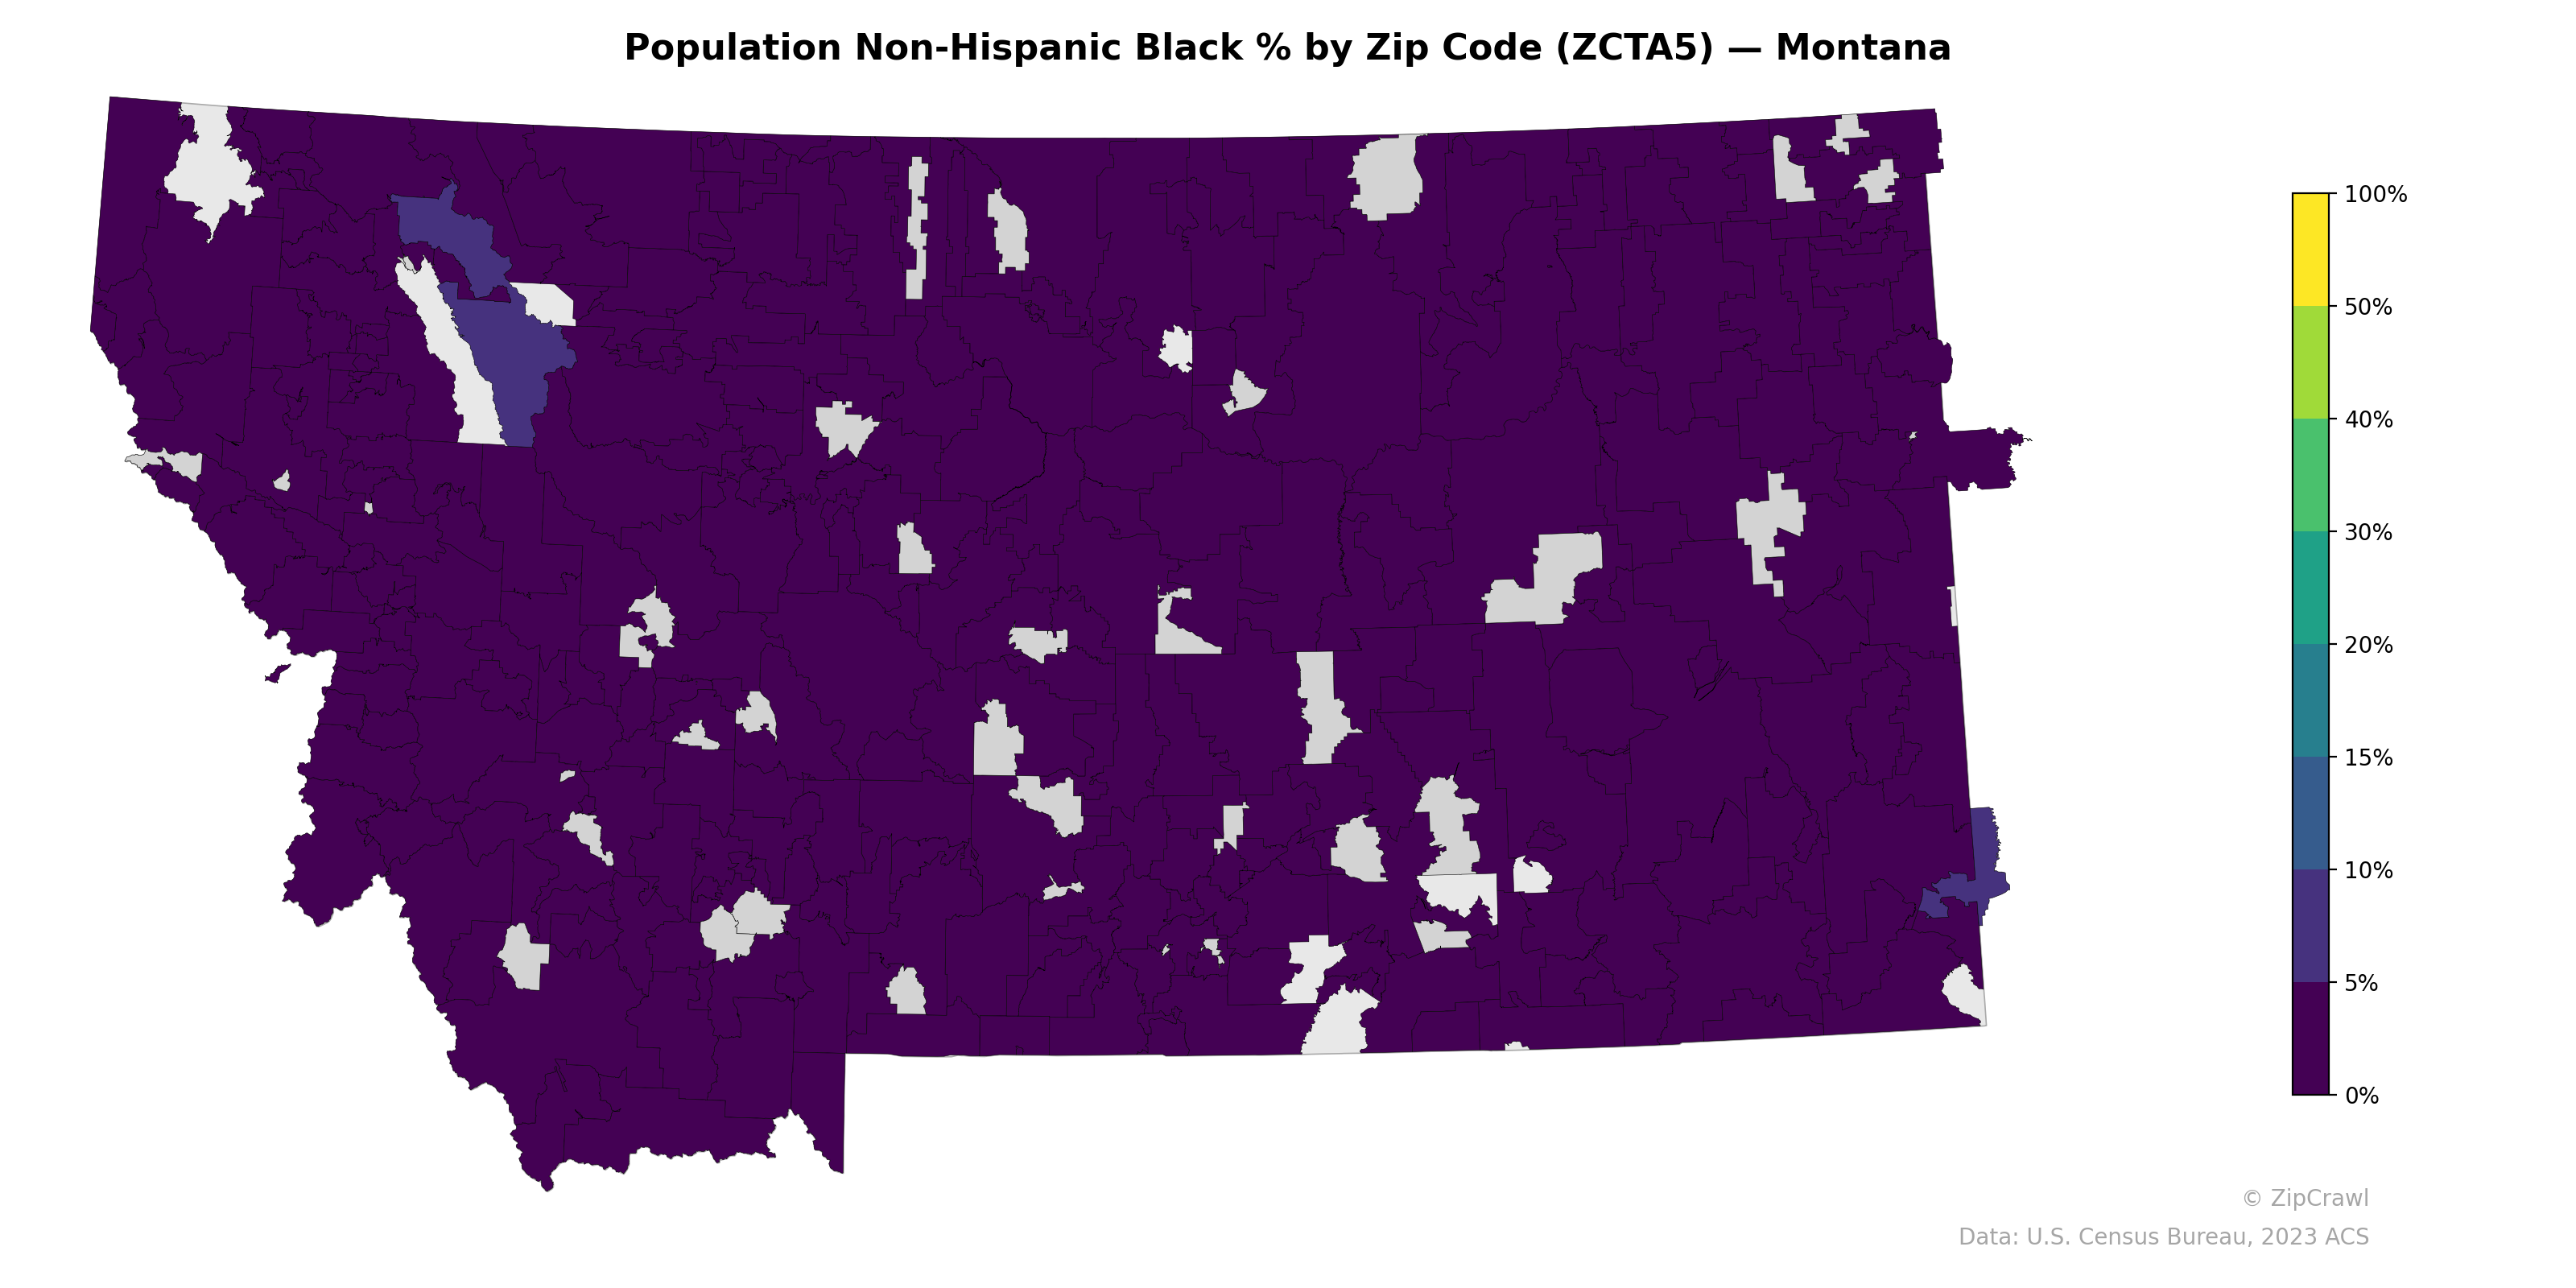
NOTE: Gray indicates insufficient data or a suppressed estimate.
Montana's Non-Hispanic Black population is extremely sparse statewide, with the vast majority of zip codes registering near 0%, reflected in the uniformly deep purple shading across nearly the entire state. The only notable exception is a small cluster in the far southeast corner of the state, likely corresponding to zip codes near the Malmstrom Air Force Base area or Billings metro, where slightly elevated percentages in the 5–10% range appear. A few zip codes in the northwestern part of the state near Flathead Lake also show marginally higher concentrations around 3–5%, though these remain well below national averages.
Data: U.S. Census Bureau, 2023 ACS
Explore
- Married Couple (% of all Households) by Zip Code (ZCTA5) — Maine
- Population Non-Hispanic Asian % by Zip Code (ZCTA5) — Maine
- Household Median Income by Zip Code (ZCTA5) — Montana
- % of Population on Food Stamps or SNAP (Last 12 Months), by Zip Code (ZCTA5) — Maine
- Population Non-Hispanic White % by Zip Code (ZCTA5) — Montana
- Population Hispanic % by Zip Code (ZCTA5) — Montana
- Median Age by Zip Code (ZCTA5) — Montana
- U.S. Citizens (% of Population Over 18) by Zip Code (ZCTA5) — Montana
- Housing Vacancy Rate by Zip Code (ZCTA5) — Maine
- U.S. Citizens by County (% of Population Over 18)
- High School Graduate (% of Over 25) by Zip Code (ZCTA5) — New York
- Housing Vacancy Rate by Zip Code (ZCTA5) — Illinois
- Housing Vacancy Rate by Zip Code (ZCTA5) — Washington
- Household Median Income by Zip Code (ZCTA5) — New York
- Median Age by Zip Code (ZCTA5) — New York
- U.S. Citizens (% of Population Over 18) by Zip Code (ZCTA5) — New York
- Population Non-Hispanic White % by Zip Code (ZCTA5) — New York
- Population Hispanic % by Zip Code (ZCTA5) — New York
- Population Non-Hispanic Asian % by Zip Code (ZCTA5) — Florida
- % of Population on Food Stamps or SNAP (Last 12 Months), by Zip Code (ZCTA5) — Florida
- Population Non-Hispanic American Indian % by Zip Code (ZCTA5) — New York
- Population Non-Hispanic Asian % by Zip Code (ZCTA5) — West Virginia
- % of Households with Broadband Internet, by Zip Code (ZCTA5) — West Virginia
- % of Population on Food Stamps or SNAP (Last 12 Months), by Zip Code (ZCTA5) — West Virginia
- Population Hispanic % by Zip Code (ZCTA5) — Hawaii
- % of Population without Health Insurance, by Zip Code (ZCTA5) — West Virginia
- High School Graduate (% of Over 25) by Zip Code (ZCTA5) — West Virginia
- Population Non-Hispanic American Indian % by Zip Code (ZCTA5) — West Virginia
- Bachelor's Degree or Higher (% of Over 25) by Zip Code (ZCTA5) — West Virginia
- Housing Vacancy Rate by Zip Code (ZCTA5) — West Virginia
- Population Non-Hispanic Black % by Zip Code (ZCTA5) — Vermont
- Population Non-Hispanic Black % by Zip Code (ZCTA5) — Indiana
- Population Non-Hispanic Black % by Zip Code (ZCTA5) — Maine
- Population Non-Hispanic Black % by Zip Code (ZCTA5) — Utah
- Population Non-Hispanic Black % by Zip Code (ZCTA5) — Iowa
- Population Non-Hispanic Black % by Zip Code (ZCTA5) — Ohio
- Population Non-Hispanic Black % by Zip Code (ZCTA5) — Louisiana
- Population Non-Hispanic Black % by Zip Code (ZCTA5) — Arizona
- Population Non-Hispanic Black % by Zip Code (ZCTA5) — Nevada
- Population Non-Hispanic Black % by Zip Code (ZCTA5) — Texas