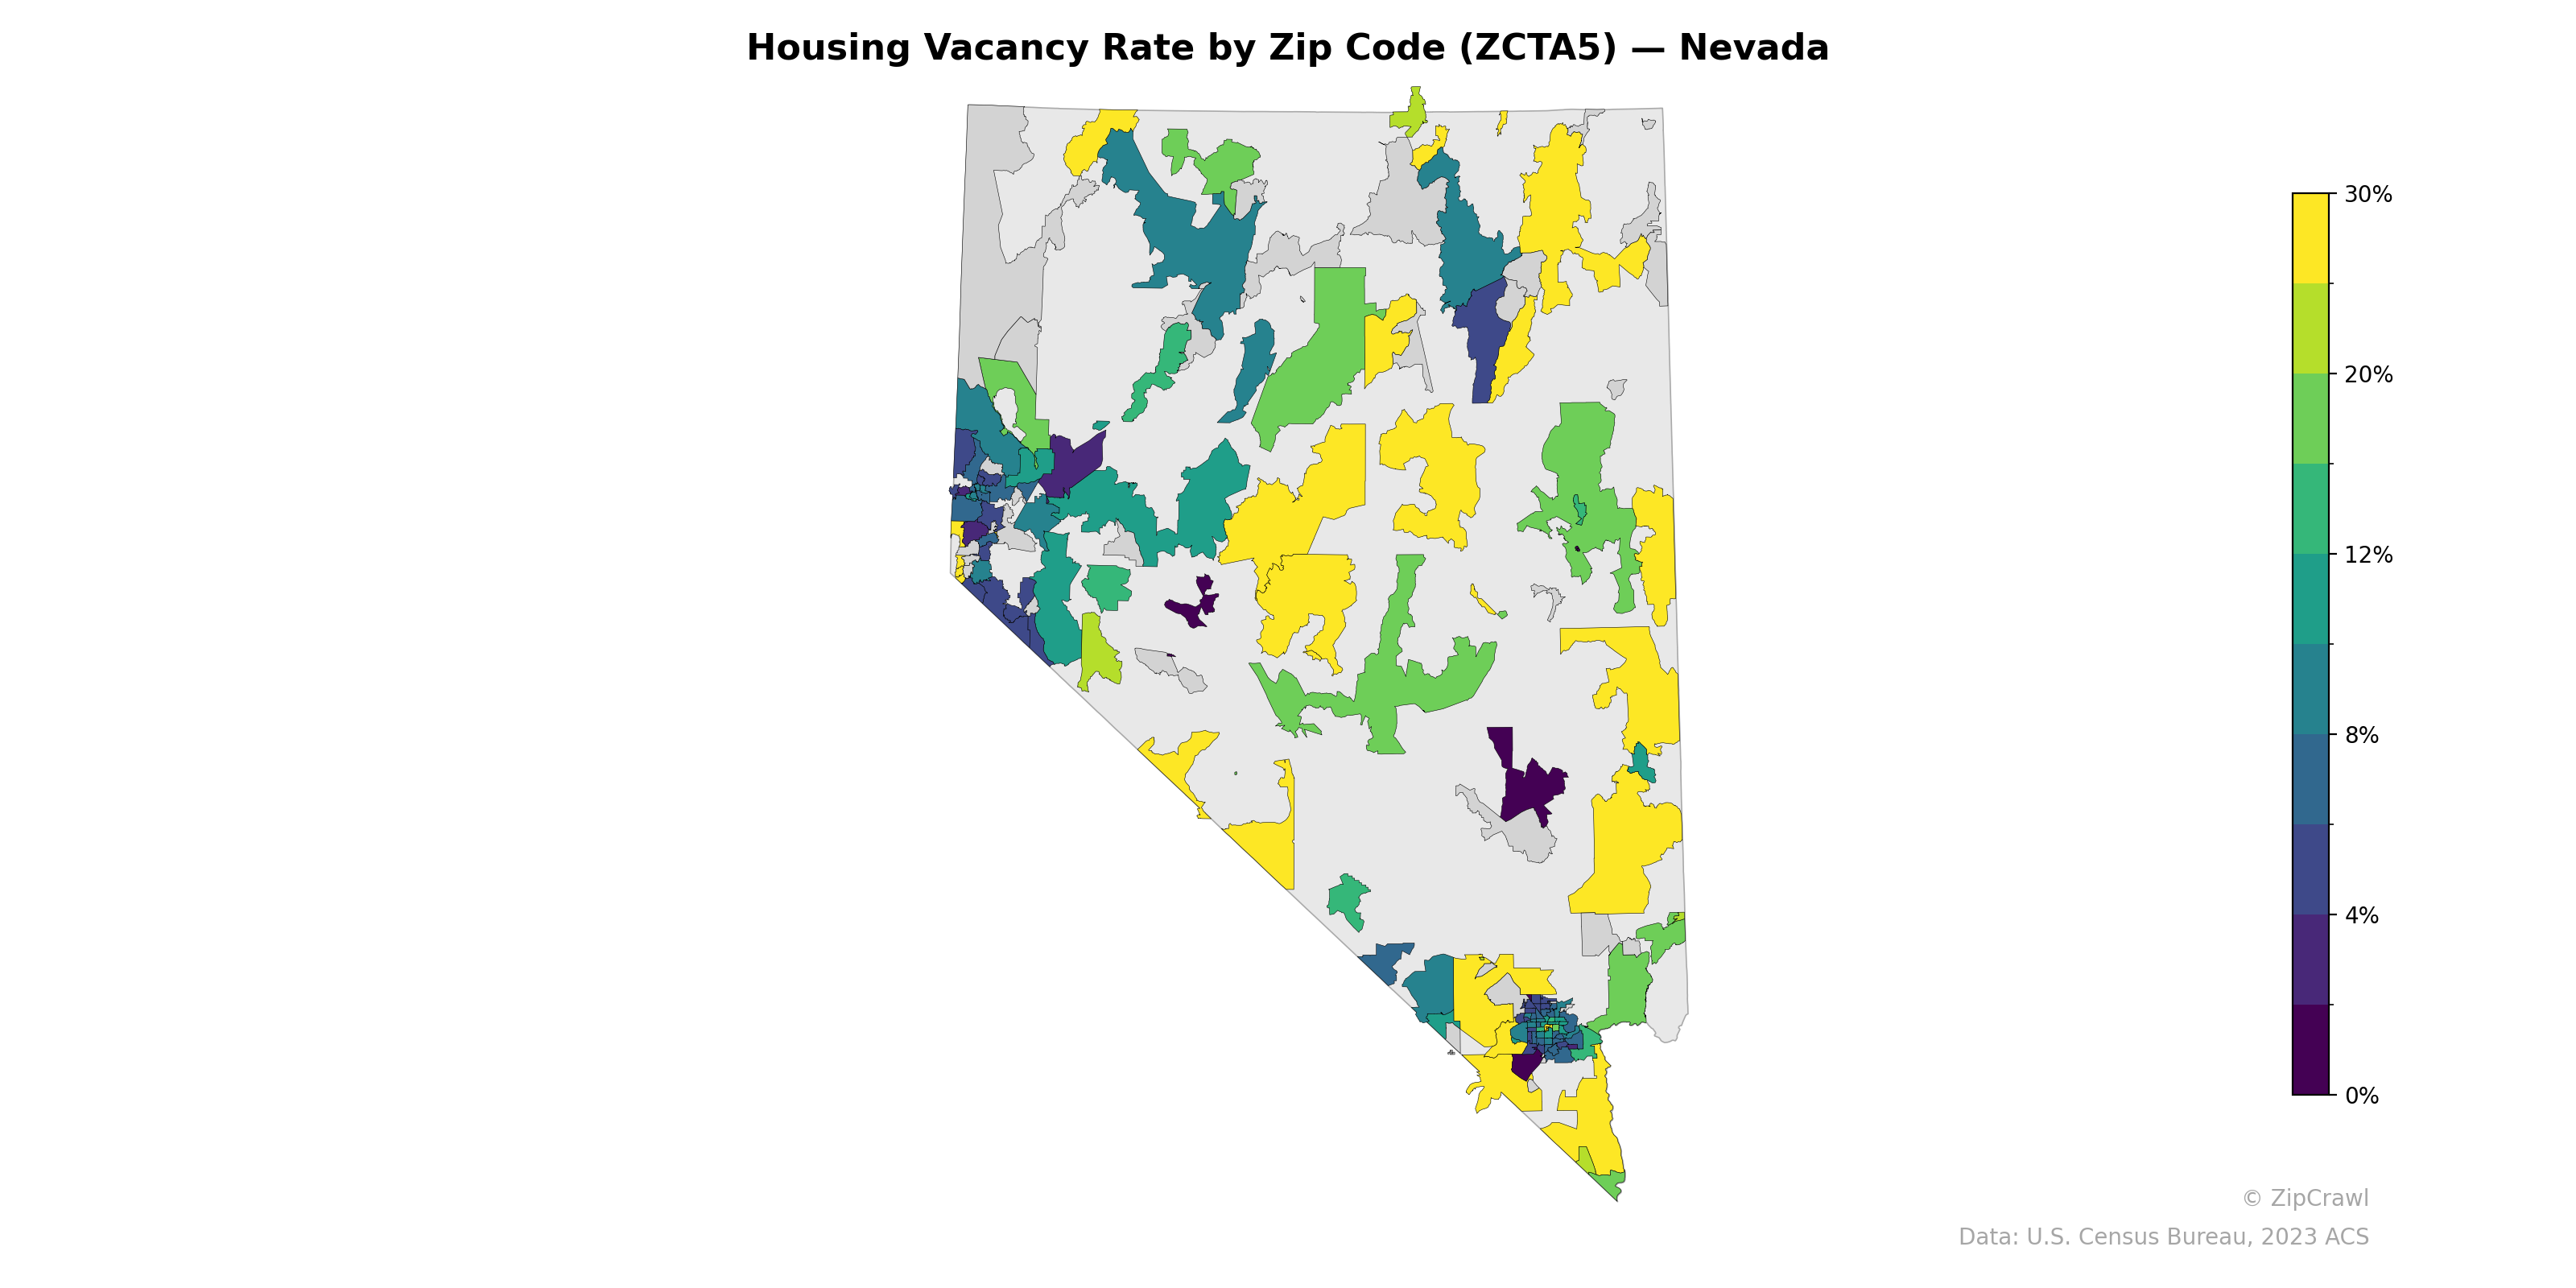
NOTE: Gray indicates insufficient data or a suppressed estimate.
Nevada's housing vacancy rates exhibit a stark urban-rural divide, with the Las Vegas metropolitan area in the south displaying notably low vacancy rates (deep purple, near 0–4%), reflecting high housing demand, while many rural and semi-rural zip codes across central and eastern Nevada show significantly elevated vacancy rates exceeding 20% (yellow). The Reno-Sparks area in the northwest presents a moderate clustering of teal-shaded zip codes in the 4–12% range, suggesting a tighter but not critically constrained market compared to Las Vegas. A scattered pattern of high-vacancy yellow zip codes along Nevada's eastern border and in remote central areas likely corresponds to small communities with limited economic activity and seasonal or abandoned housing stock.
Data: U.S. Census Bureau, 2023 ACS
Explore
- Population Non-Hispanic Black % by Zip Code (ZCTA5) — Florida
- Population Non-Hispanic White % by Zip Code (ZCTA5) — Arkansas
- Married Couple (% of all Households) by Zip Code (ZCTA5) — Nevada
- % of Population on Food Stamps or SNAP (Last 12 Months), by Zip Code (ZCTA5) — Nevada
- Population Hispanic % by Zip Code (ZCTA5) — Arkansas
- Population Non-Hispanic Black % by Zip Code (ZCTA5) — Arkansas
- Median Age by Zip Code (ZCTA5) — Arkansas
- Household Median Income by Zip Code (ZCTA5) — Arkansas
- U.S. Citizens (% of Population Over 18) by Zip Code (ZCTA5) — Arkansas
- Population Non-Hispanic Asian % by Zip Code (ZCTA5) — Nevada
- Housing Owner-Occupied Median Value ($), by County
- % of Households with Broadband Internet, by Zip Code (ZCTA5) — Houston Metro
- High School Graduate (% of Over 25) by Zip Code (ZCTA5) — Florida
- % of Households with Broadband Internet, by Zip Code (ZCTA5) — Illinois
- Population Hispanic % by Zip Code (ZCTA5) — Florida
- Household Median Income by Zip Code (ZCTA5) — Florida
- Median Age by Zip Code (ZCTA5) — Florida
- Population Non-Hispanic Asian % by Zip Code (ZCTA5) — California
- % of Population on Food Stamps or SNAP (Last 12 Months), by Zip Code (ZCTA5) — California
- U.S. Citizens (% of Population Over 18) by Zip Code (ZCTA5) — Florida
- Population Non-Hispanic American Indian % by Zip Code (ZCTA5) — Florida
- Population Non-Hispanic White % by Zip Code (ZCTA5) — Florida
- Housing % of Units Built Since 2010, by Zip Code (ZCTA5) — Connecticut
- Population Non-Hispanic American Indian % by Zip Code (ZCTA5) — Connecticut
- Household Average Size by Zip Code (ZCTA5) — Connecticut
- Housing Median Monthly Rent ($), by Zip Code (ZCTA5) — Nevada
- Population Hispanic % by Zip Code (ZCTA5) — Mississippi
- Household Median Income by Zip Code (ZCTA5) — Iowa
- Median Age by Zip Code (ZCTA5) — Iowa
- High School Graduate (% of Over 25) by Zip Code (ZCTA5) — Connecticut
- Housing Vacancy Rate by Zip Code (ZCTA5) — New York
- Housing Vacancy Rate by Zip Code (ZCTA5) — Nebraska
- Housing Vacancy Rate by Zip Code (ZCTA5) — Iowa
- Housing Vacancy Rate by Zip Code (ZCTA5) — Ohio
- Housing Vacancy Rate by Zip Code (ZCTA5) — Utah
- Housing Vacancy Rate by Zip Code (ZCTA5) — Florida
- Housing Vacancy Rate by Zip Code (ZCTA5) — Idaho
- Housing Vacancy Rate by Zip Code (ZCTA5) — Texas
- Housing Vacancy Rate by Zip Code (ZCTA5) — Hawaii
- Housing Vacancy Rate by Zip Code (ZCTA5) — Maine