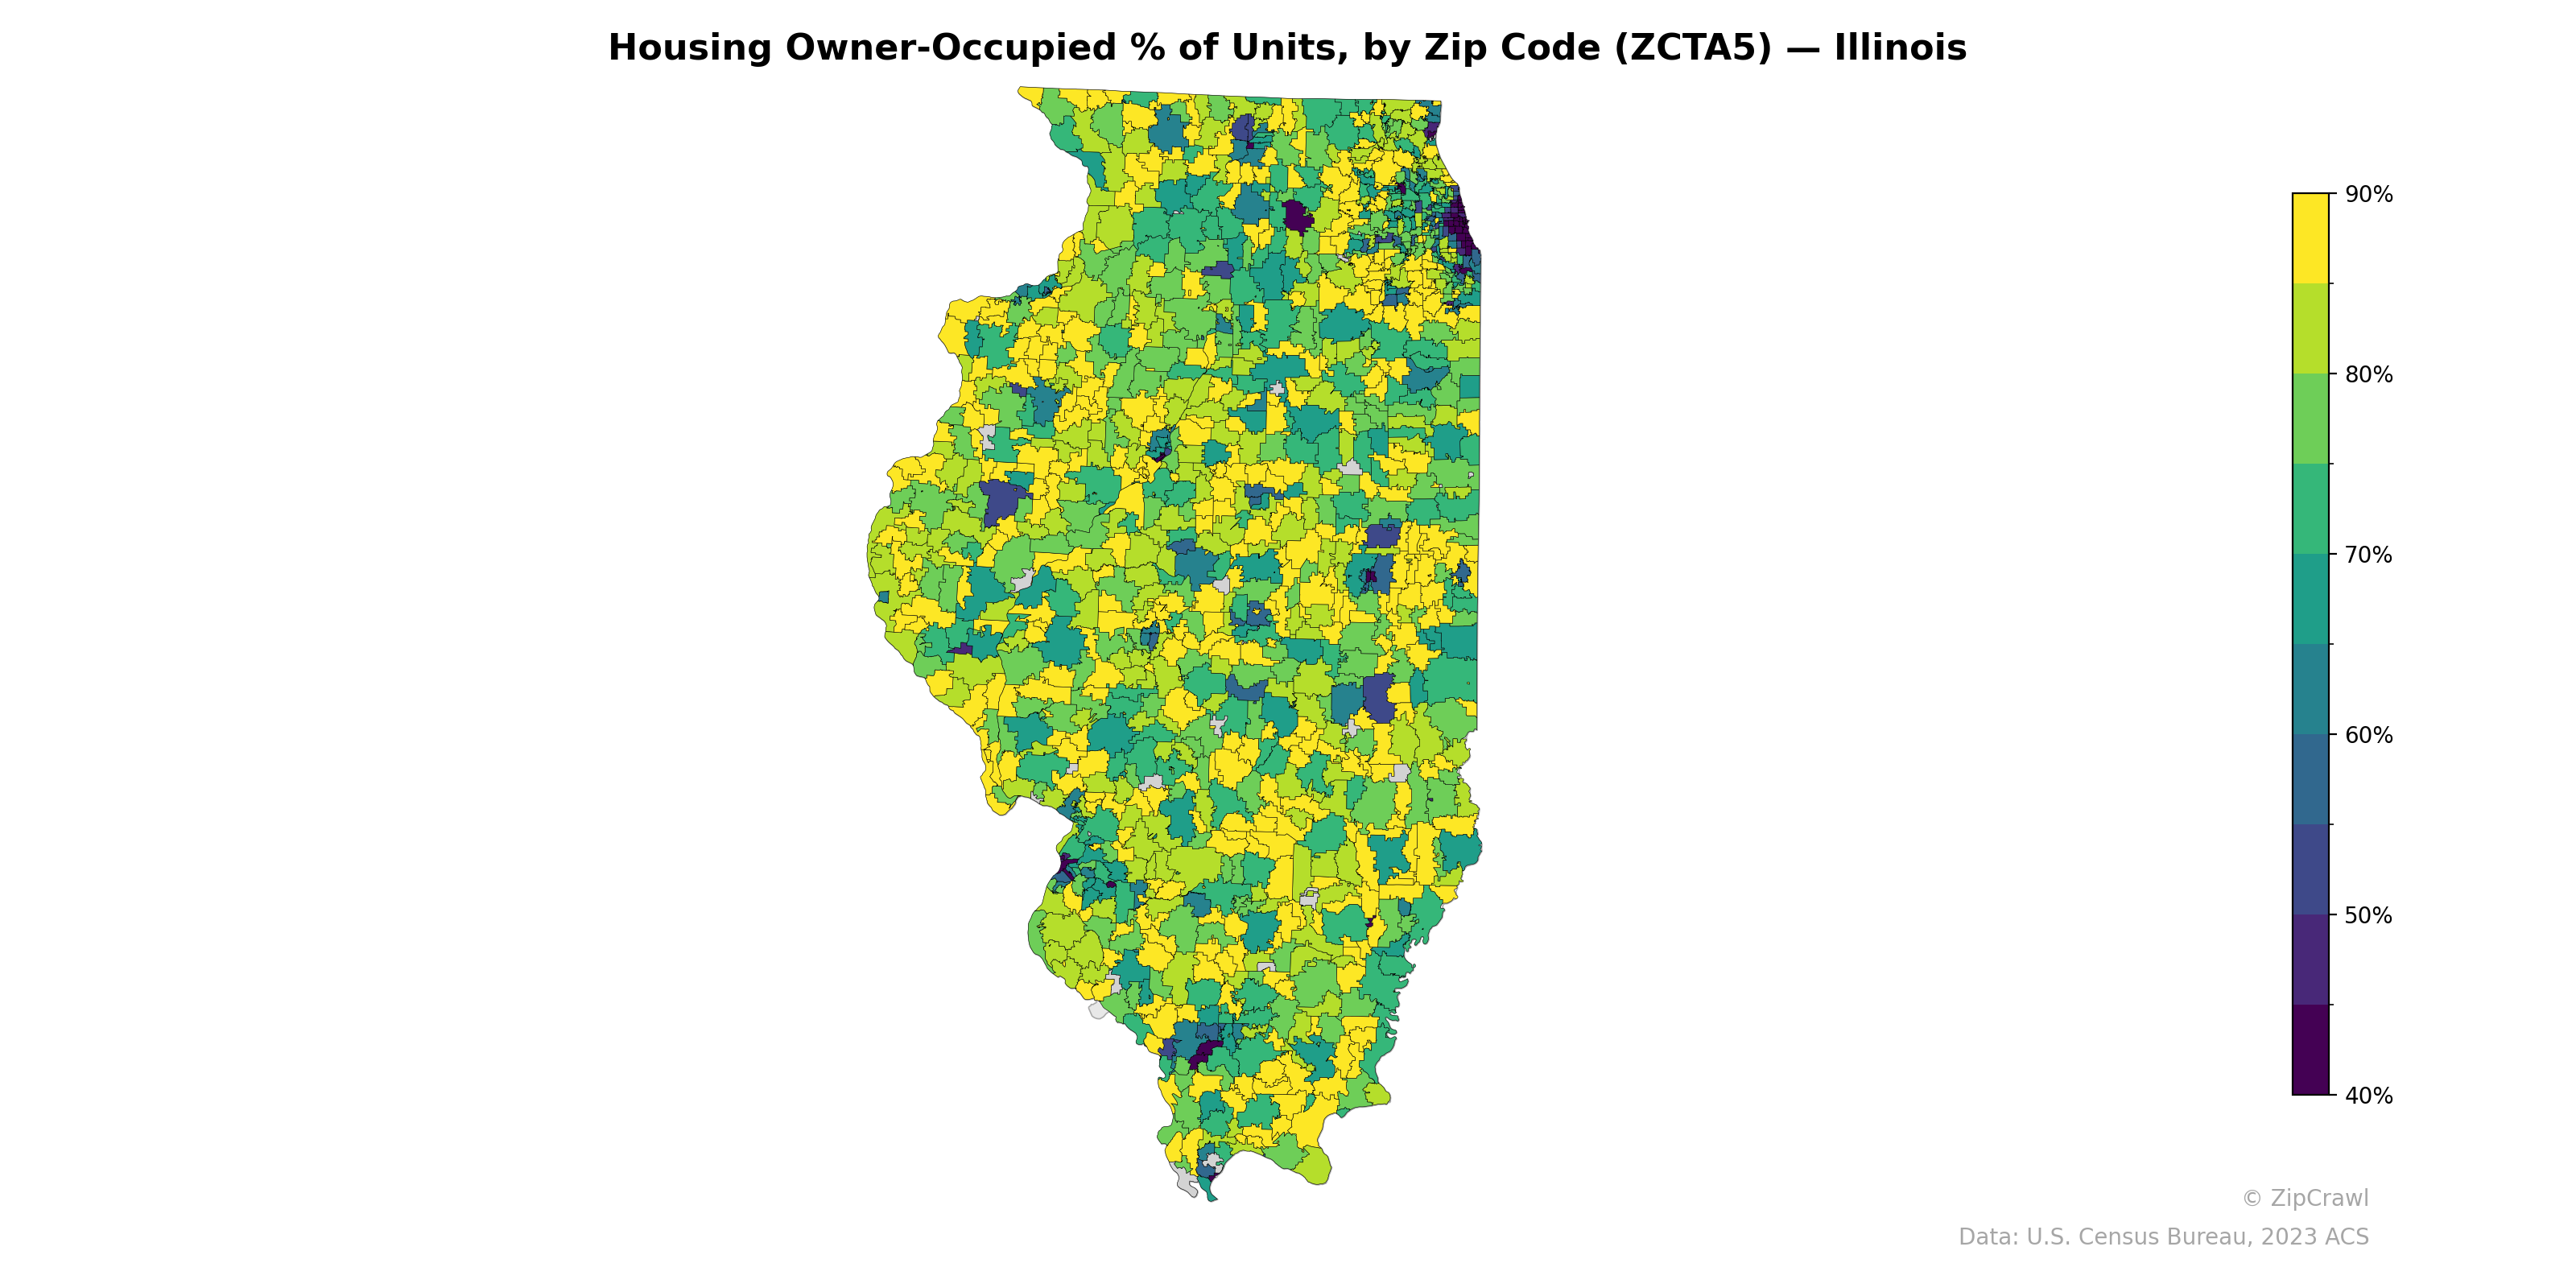
NOTE: Gray indicates insufficient data or a suppressed estimate.
Owner-occupancy rates across Illinois exhibit a strong urban-rural divide, with the Chicago metropolitan area in the northeast displaying the most pronounced variation—dense clusters of low owner-occupancy (below 50%) in the city core transition sharply to high-ownership suburban zip codes (above 85%) in surrounding collar counties. Downstate urban centers such as Champaign-Urbana, Springfield, Bloomington-Normal, and Carbondale appear as darker pockets of lower homeownership amid predominantly yellow and light green rural zip codes where owner-occupancy typically exceeds 75%. Southern Illinois generally trends toward moderate ownership rates in the 60–75% range, with somewhat more heterogeneity than the central portion of the state.
Data: U.S. Census Bureau, 2023 ACS
Explore
- % of Population on Food Stamps or SNAP (Last 12 Months), by Zip Code (ZCTA5) — Oregon
- Population Non-Hispanic Asian % by County
- % of Households with Broadband Internet, by Zip Code (ZCTA5) — Illinois
- Married Couple (% of all Households) by Zip Code (ZCTA5) — Illinois
- Housing Median Monthly Rent ($), by Zip Code (ZCTA5) — Illinois
- Bachelor's Degree or Higher (% of Over 25) by Zip Code (ZCTA5) — Illinois
- Housing Vacancy Rate by Zip Code (ZCTA5) — Illinois
- % of Population without Health Insurance, by Zip Code (ZCTA5) — Illinois
- Household Average Size by Zip Code (ZCTA5) — Illinois
- Housing % of Units Built Since 2010, by Zip Code (ZCTA5) — Illinois
- Housing Owner-Occupied Median Value ($), by Zip Code (ZCTA5) — Illinois
- % of Population on Food Stamps or SNAP (Last 12 Months), by Zip Code (ZCTA5) — Nebraska
- % of Population on Food Stamps or SNAP (Last 12 Months), by Zip Code (ZCTA5) — Maine
- % of Population on Food Stamps or SNAP (Last 12 Months), by Zip Code (ZCTA5) — North Dakota
- % of Population on Food Stamps or SNAP (Last 12 Months), by Zip Code (ZCTA5) — Nevada
- Household Median Income by County
- Household Average Size by County
- Married Couple (% of all Households) by County
- U.S. Citizens by County (% of Population Over 18)
- Housing Median Monthly Rent ($), by County
- Housing Owner-Occupied Median Value ($), by County
- % of Households with Broadband Internet, by County
- Housing Vacancy Rate by County
- Housing % of Units Built Since 2010, by County
- Housing Owner-Occupied Median Value ($), by Zip Code (ZCTA5) — California
- Bachelor's Degree or Higher (% of Over 25) by Zip Code (ZCTA5) — California
- % of Population without Health Insurance, by Zip Code (ZCTA5) — California
- Housing % of Units Built Since 2010, by Zip Code (ZCTA5) — California
- Population Non-Hispanic American Indian % by Zip Code (ZCTA5) — California
- High School Graduate (% of Over 25) by Zip Code (ZCTA5) — California
- Housing Owner-Occupied % of Units, by Zip Code (ZCTA5) — Iowa
- Housing Owner-Occupied % of Units, by Zip Code (ZCTA5) — Idaho
- Housing Owner-Occupied % of Units, by Zip Code (ZCTA5) — Ohio
- Housing Owner-Occupied % of Units, by Zip Code (ZCTA5) — Utah
- Housing Owner-Occupied % of Units, by Zip Code (ZCTA5) — Indiana
- Housing Owner-Occupied % of Units, by Zip Code (ZCTA5) — Oregon
- Housing Owner-Occupied % of Units, by Zip Code (ZCTA5) — Texas
- Housing Owner-Occupied % of Units, by Zip Code (ZCTA5) — Maine
- Housing Owner-Occupied % of Units, by Zip Code (ZCTA5) — Hawaii
- Housing Owner-Occupied % of Units, by Zip Code (ZCTA5) — Wyoming