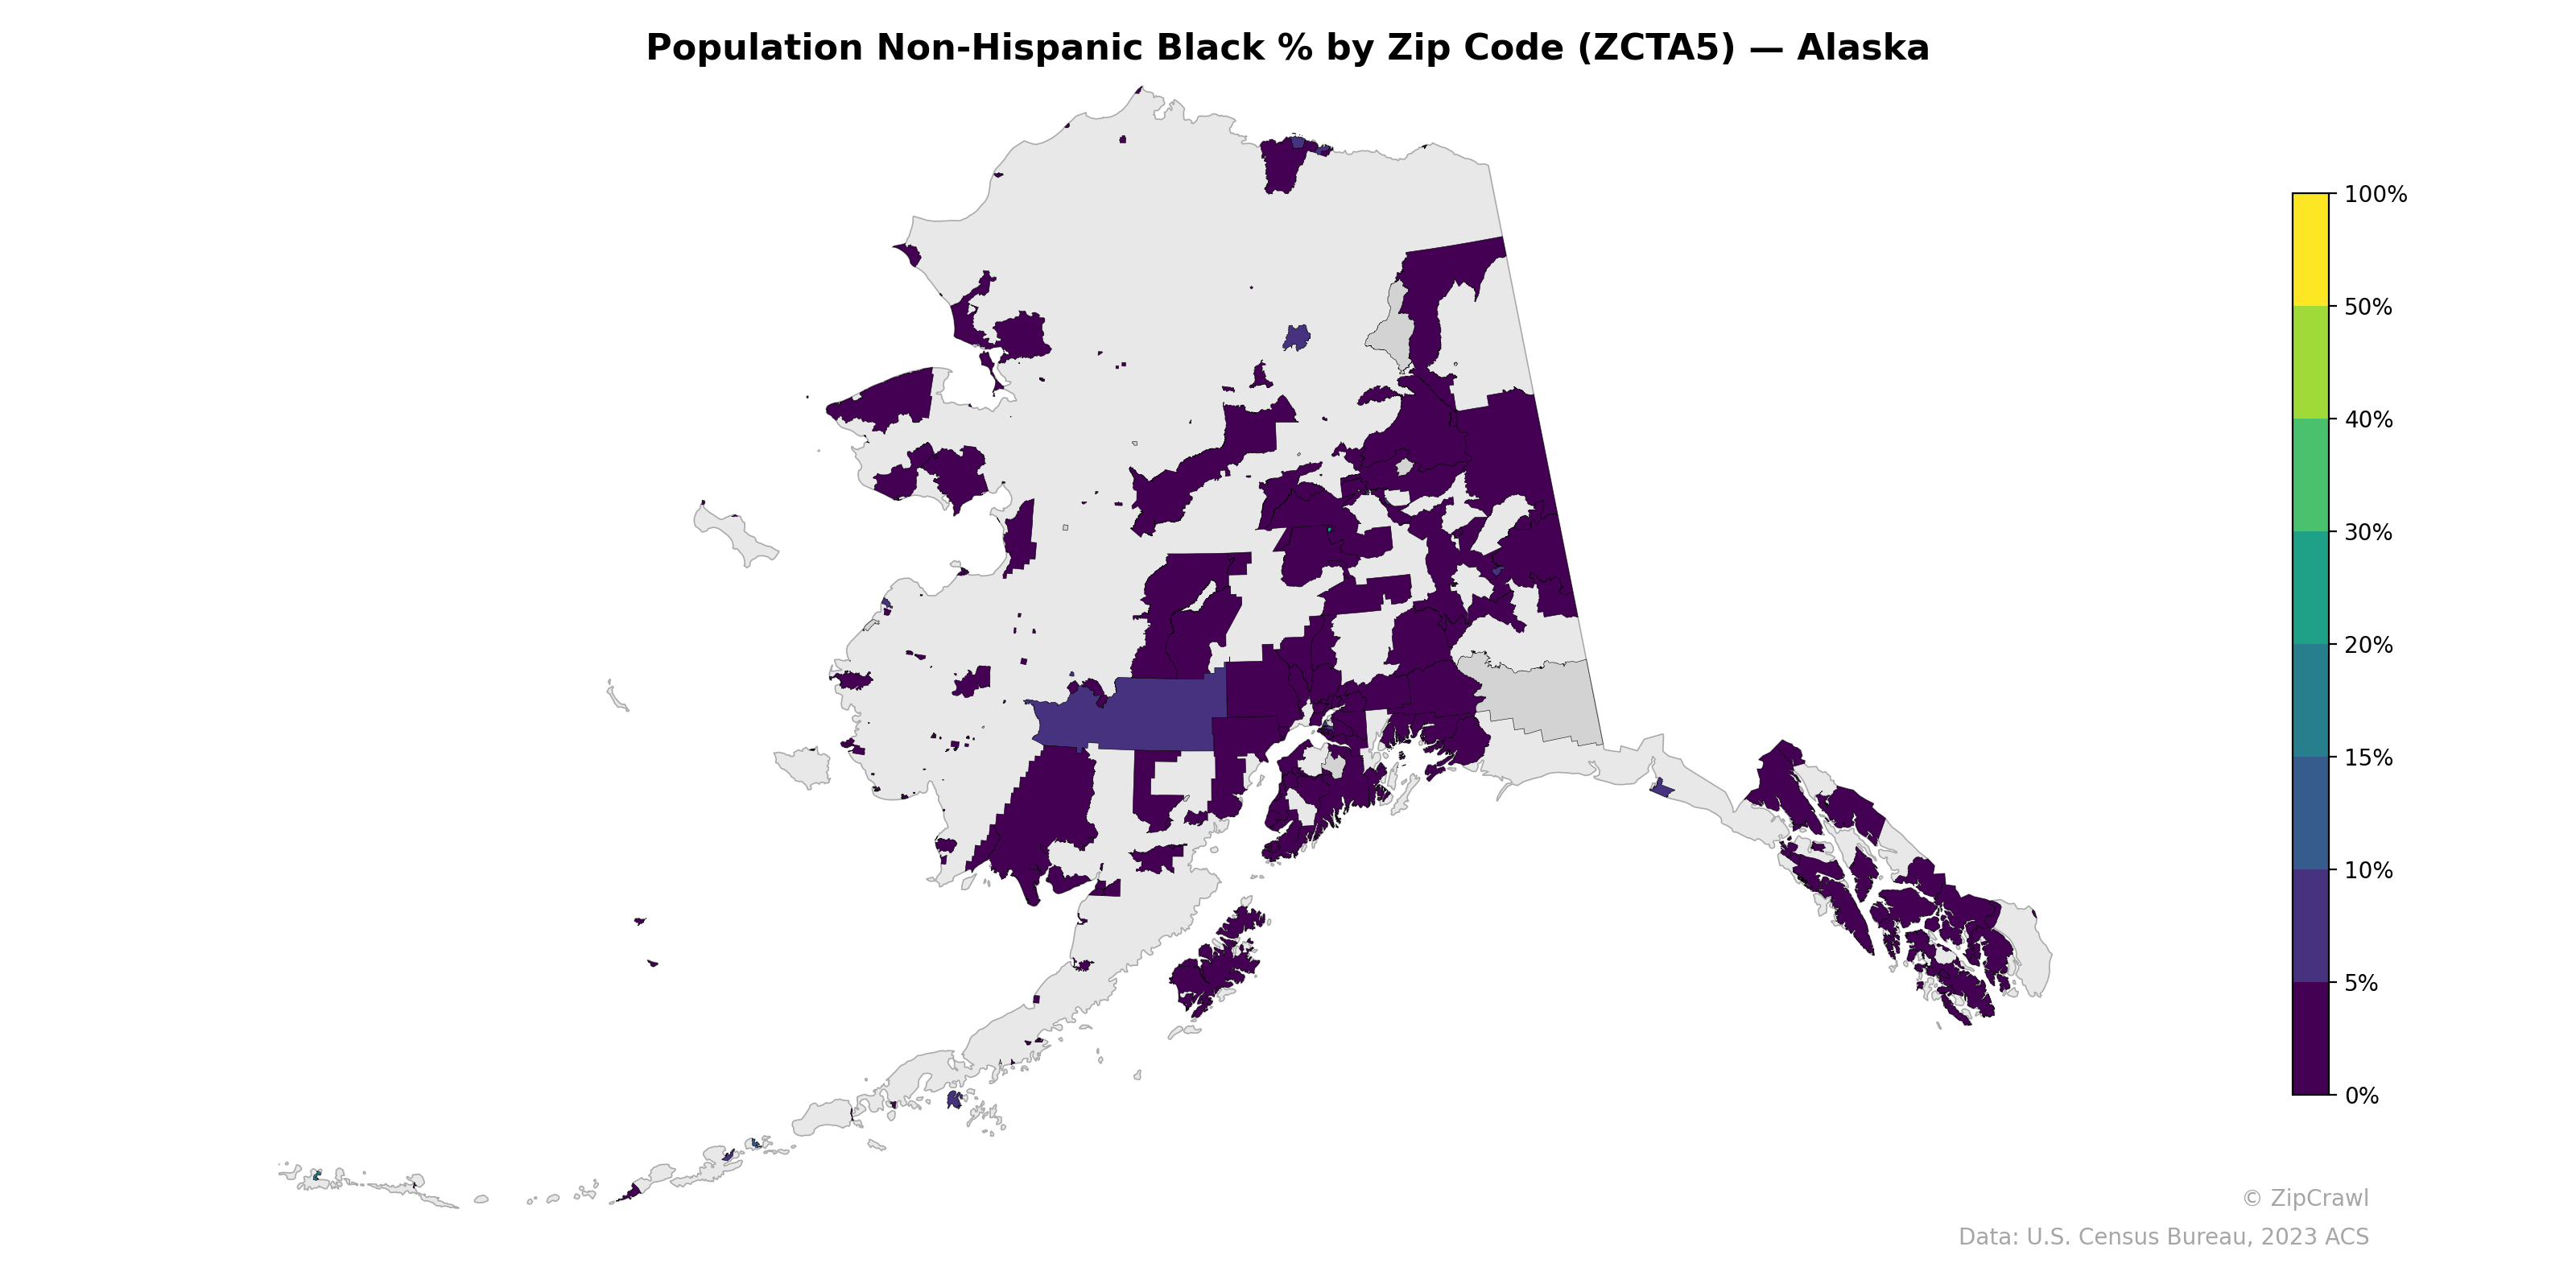
NOTE: Gray indicates insufficient data or a suppressed estimate.
Alaska's Non-Hispanic Black population percentages are uniformly low across nearly all zip codes, with the vast majority falling below 5%, reflecting the state's overall demographic composition. Slightly elevated concentrations appear in zip codes around the Anchorage and Fairbanks areas, likely corresponding to military installations such as Joint Base Elmendorf-Richardson and Eielson Air Force Base, which historically drive higher Black population shares in otherwise demographically homogeneous regions. Rural and remote zip codes across western Alaska, the Interior, and the Aleutian chain consistently register near-zero percentages, showing virtually no geographic variation outside the state's limited urban corridors.
Data: U.S. Census Bureau, 2023 ACS
Explore
- Household Average Size by Zip Code (ZCTA5) — New York
- Median Age by Zip Code (ZCTA5) — Alaska
- % of Population on Food Stamps or SNAP (Last 12 Months), by Zip Code (ZCTA5) — North Dakota
- Housing Vacancy Rate by Zip Code (ZCTA5) — North Dakota
- Population Non-Hispanic White % by Zip Code (ZCTA5) — Alaska
- Household Median Income by Zip Code (ZCTA5) — Alaska
- U.S. Citizens (% of Population Over 18) by Zip Code (ZCTA5) — Alaska
- Population Non-Hispanic Asian % by Zip Code (ZCTA5) — North Dakota
- Married Couple (% of all Households) by Zip Code (ZCTA5) — North Dakota
- Population Hispanic % by Zip Code (ZCTA5) — Alaska
- Household Average Size by County
- Housing Vacancy Rate by Zip Code (ZCTA5) — Illinois
- Married Couple (% of all Households) by Zip Code (ZCTA5) — New York
- Housing Vacancy Rate by Zip Code (ZCTA5) — Missouri
- Housing Owner-Occupied Median Value ($), by Zip Code (ZCTA5) — New York
- % of Population without Health Insurance, by Zip Code (ZCTA5) — New York
- Housing Median Monthly Rent ($), by Zip Code (ZCTA5) — New York
- Housing Vacancy Rate by Zip Code (ZCTA5) — New York
- Bachelor's Degree or Higher (% of Over 25) by Zip Code (ZCTA5) — New York
- % of Households with Broadband Internet, by Zip Code (ZCTA5) — New York
- Housing % of Units Built Since 2010, by Zip Code (ZCTA5) — New York
- Housing Owner-Occupied % of Units, by Zip Code (ZCTA5) — New York
- Population Non-Hispanic American Indian % by Zip Code (ZCTA5) — Rhode Island
- Housing Vacancy Rate by Zip Code (ZCTA5) — Alaska
- Married Couple (% of all Households) by Zip Code (ZCTA5) — Rhode Island
- High School Graduate (% of Over 25) by Zip Code (ZCTA5) — Rhode Island
- Housing % of Units Built Since 2010, by Zip Code (ZCTA5) — Rhode Island
- Population Non-Hispanic White % by Zip Code (ZCTA5) — Oregon
- Population Non-Hispanic American Indian % by Zip Code (ZCTA5) — North Dakota
- Household Average Size by Zip Code (ZCTA5) — Rhode Island
- Population Non-Hispanic Black % by Zip Code (ZCTA5) — Nebraska
- Population Non-Hispanic Black % by Zip Code (ZCTA5) — Alabama
- Population Non-Hispanic Black % by Zip Code (ZCTA5) — Utah
- Population Non-Hispanic Black % by Zip Code (ZCTA5) — Iowa
- Population Non-Hispanic Black % by Zip Code (ZCTA5) — Ohio
- Population Non-Hispanic Black % by Zip Code (ZCTA5) — Arizona
- Population Non-Hispanic Black % by Zip Code (ZCTA5) — Nevada
- Population Non-Hispanic Black % by Zip Code (ZCTA5) — Oregon
- Population Non-Hispanic Black % by Zip Code (ZCTA5) — Texas
- Population Non-Hispanic Black % by Zip Code (ZCTA5) — Idaho