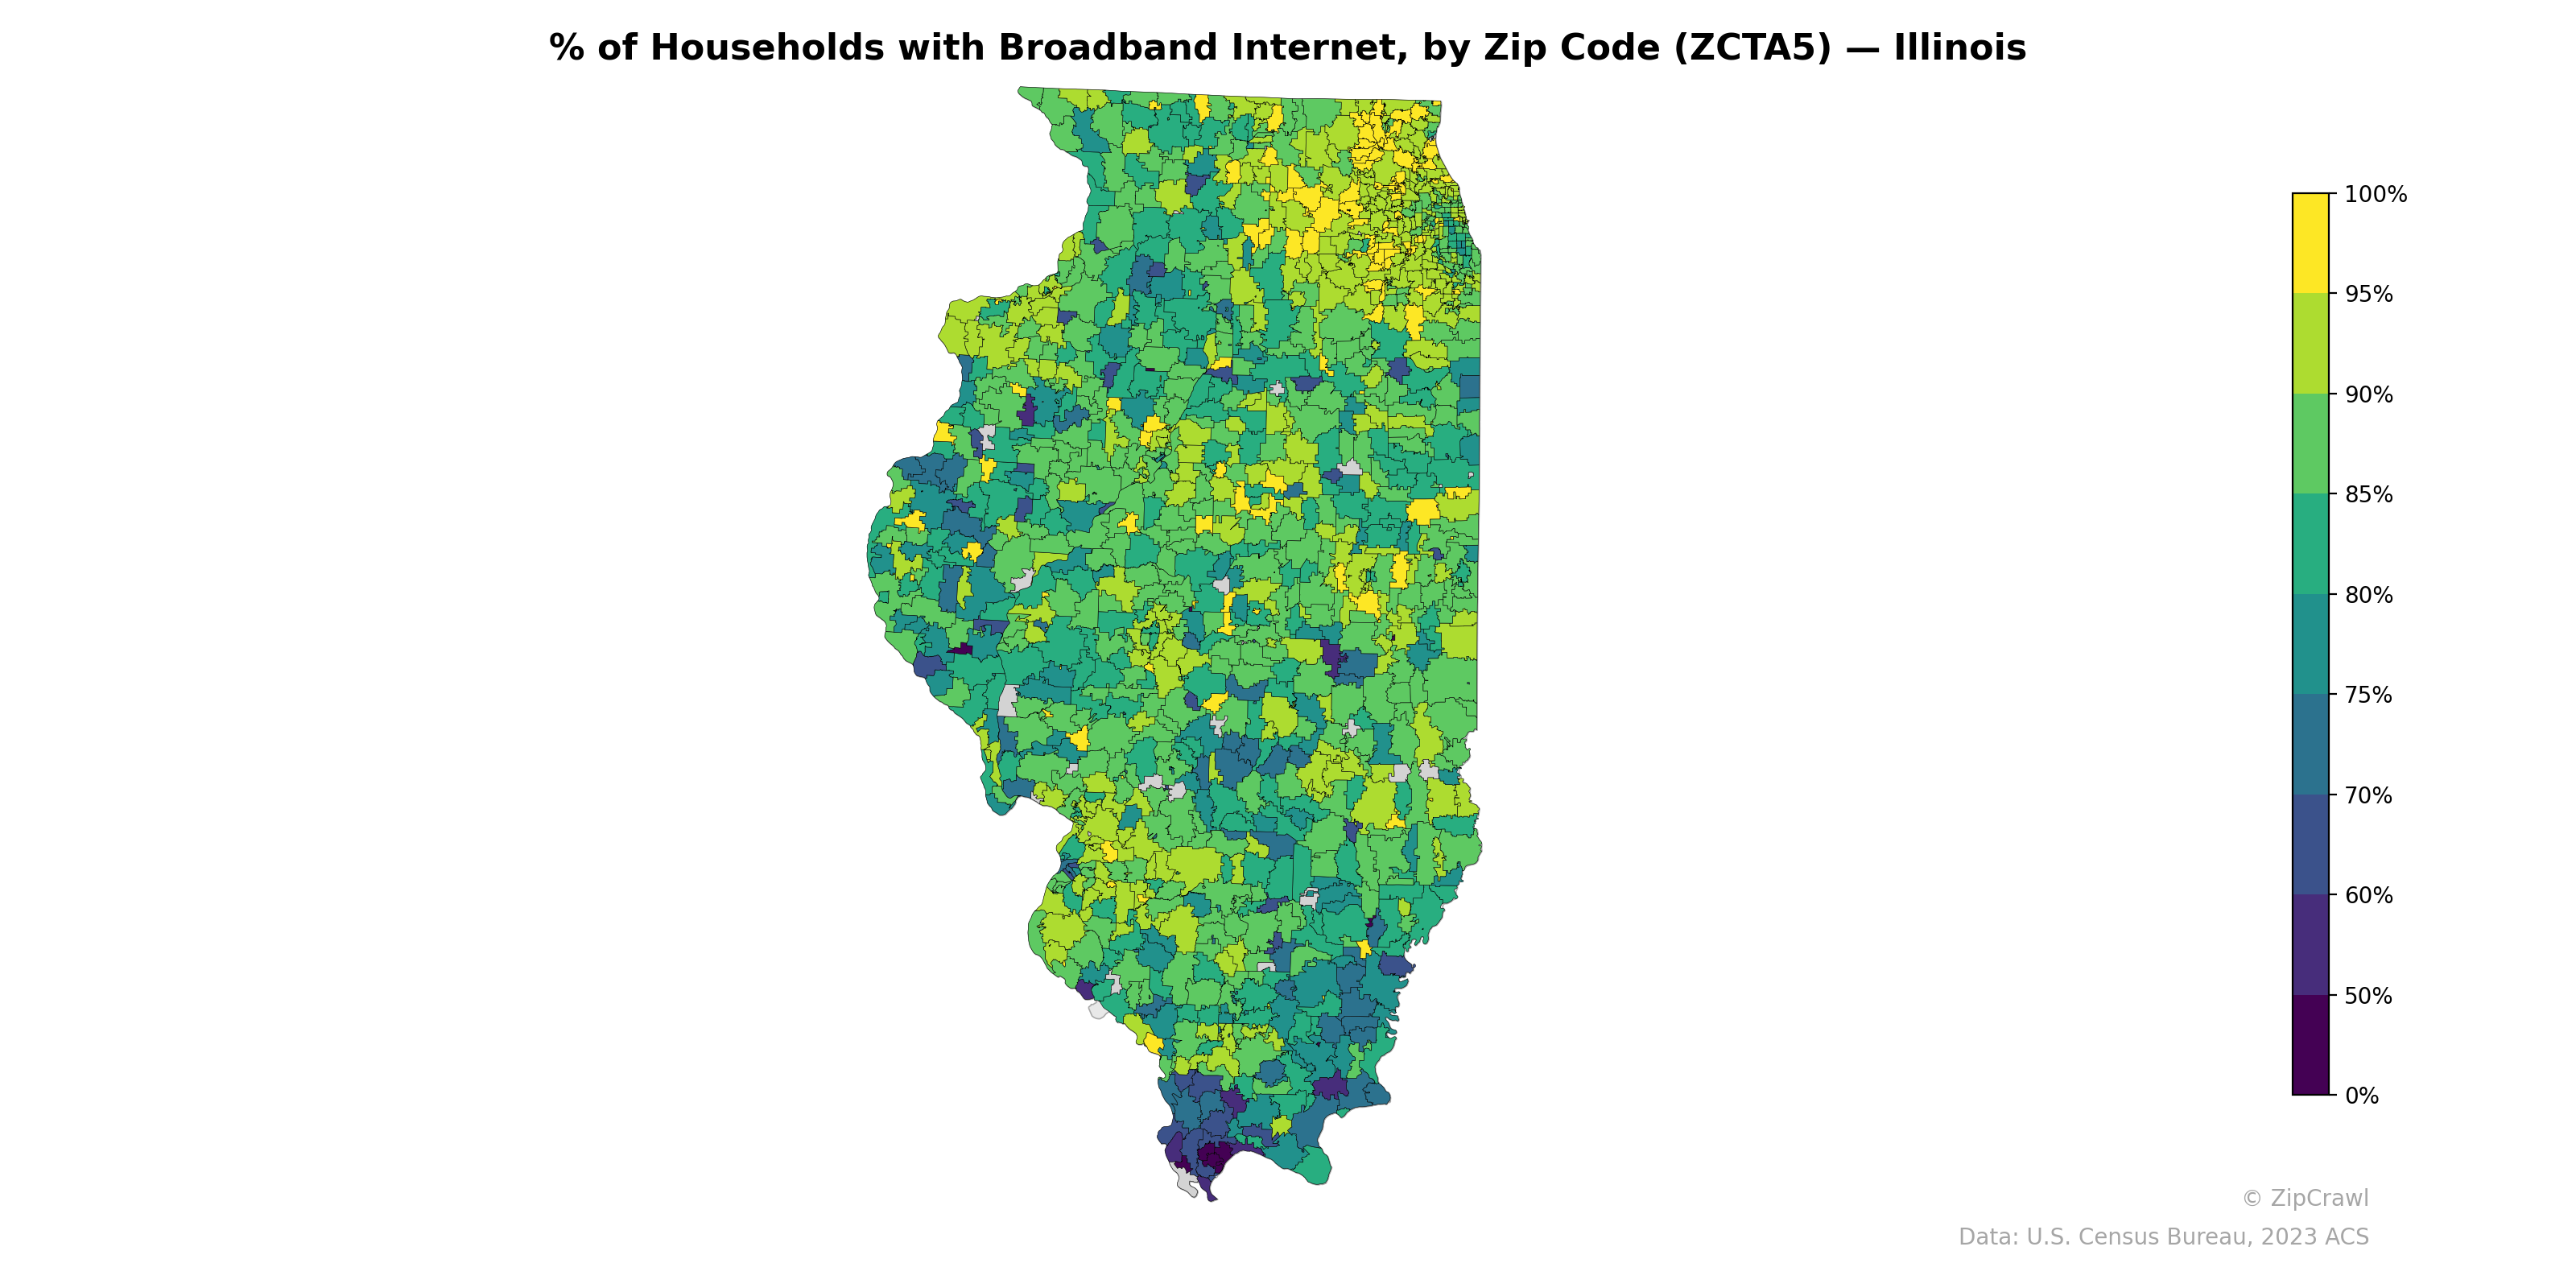
NOTE: Gray indicates insufficient data or a suppressed estimate.
The Chicago metropolitan area and its suburban collar counties display the highest broadband adoption rates, with numerous zip codes reaching 90–100%, while southern Illinois consistently lags behind, with many zip codes falling below 70–75%. Mid-state urban centers such as Springfield, Champaign-Urbana, and Peoria appear as isolated pockets of higher connectivity surrounded by lower-adoption rural areas. A pronounced north-south gradient is evident, with the deepest digital divide concentrated in the rural zip codes of far southern Illinois near the Cairo region, where rates drop to 50% or below.
Data: U.S. Census Bureau, 2023 ACS
Explore
- Housing Vacancy Rate by Zip Code (ZCTA5) — Oregon
- Population Non-Hispanic Asian % by County
- % of Population without Health Insurance, by Zip Code (ZCTA5) — Illinois
- Married Couple (% of all Households) by Zip Code (ZCTA5) — Illinois
- Housing Median Monthly Rent ($), by Zip Code (ZCTA5) — Illinois
- Bachelor's Degree or Higher (% of Over 25) by Zip Code (ZCTA5) — Illinois
- Housing Vacancy Rate by Zip Code (ZCTA5) — Illinois
- Housing Owner-Occupied % of Units, by Zip Code (ZCTA5) — Illinois
- Household Average Size by Zip Code (ZCTA5) — Illinois
- Housing % of Units Built Since 2010, by Zip Code (ZCTA5) — Illinois
- Housing Owner-Occupied Median Value ($), by Zip Code (ZCTA5) — Illinois
- Housing Vacancy Rate by Zip Code (ZCTA5) — Nebraska
- Housing Vacancy Rate by Zip Code (ZCTA5) — Maine
- Housing Vacancy Rate by Zip Code (ZCTA5) — North Dakota
- Housing Vacancy Rate by Zip Code (ZCTA5) — Nevada
- Household Median Income by County
- Household Average Size by County
- Married Couple (% of all Households) by County
- U.S. Citizens by County (% of Population Over 18)
- Housing Median Monthly Rent ($), by County
- Housing Owner-Occupied Median Value ($), by County
- Housing Owner-Occupied % of Units, by County
- Housing Vacancy Rate by County
- Housing % of Units Built Since 2010, by County
- Housing Owner-Occupied Median Value ($), by Zip Code (ZCTA5) — California
- % of Population without Health Insurance, by Zip Code (ZCTA5) — California
- Housing Owner-Occupied % of Units, by Zip Code (ZCTA5) — California
- Housing % of Units Built Since 2010, by Zip Code (ZCTA5) — California
- High School Graduate (% of Over 25) by Zip Code (ZCTA5) — California
- Housing Median Monthly Rent ($), by Zip Code (ZCTA5) — California
- % of Households with Broadband Internet, by Zip Code (ZCTA5) — Ohio
- % of Households with Broadband Internet, by Zip Code (ZCTA5) — Iowa
- % of Households with Broadband Internet, by Zip Code (ZCTA5) — Idaho
- % of Households with Broadband Internet, by Zip Code (ZCTA5) — Utah
- % of Households with Broadband Internet, by Zip Code (ZCTA5) — Texas
- % of Households with Broadband Internet, by Zip Code (ZCTA5) — Hawaii
- % of Households with Broadband Internet, by Zip Code (ZCTA5) — Maine
- % of Households with Broadband Internet, by Zip Code (ZCTA5) — Oregon
- % of Households with Broadband Internet, by Zip Code (ZCTA5) — Indiana
- % of Households with Broadband Internet, by Zip Code (ZCTA5) — Maryland