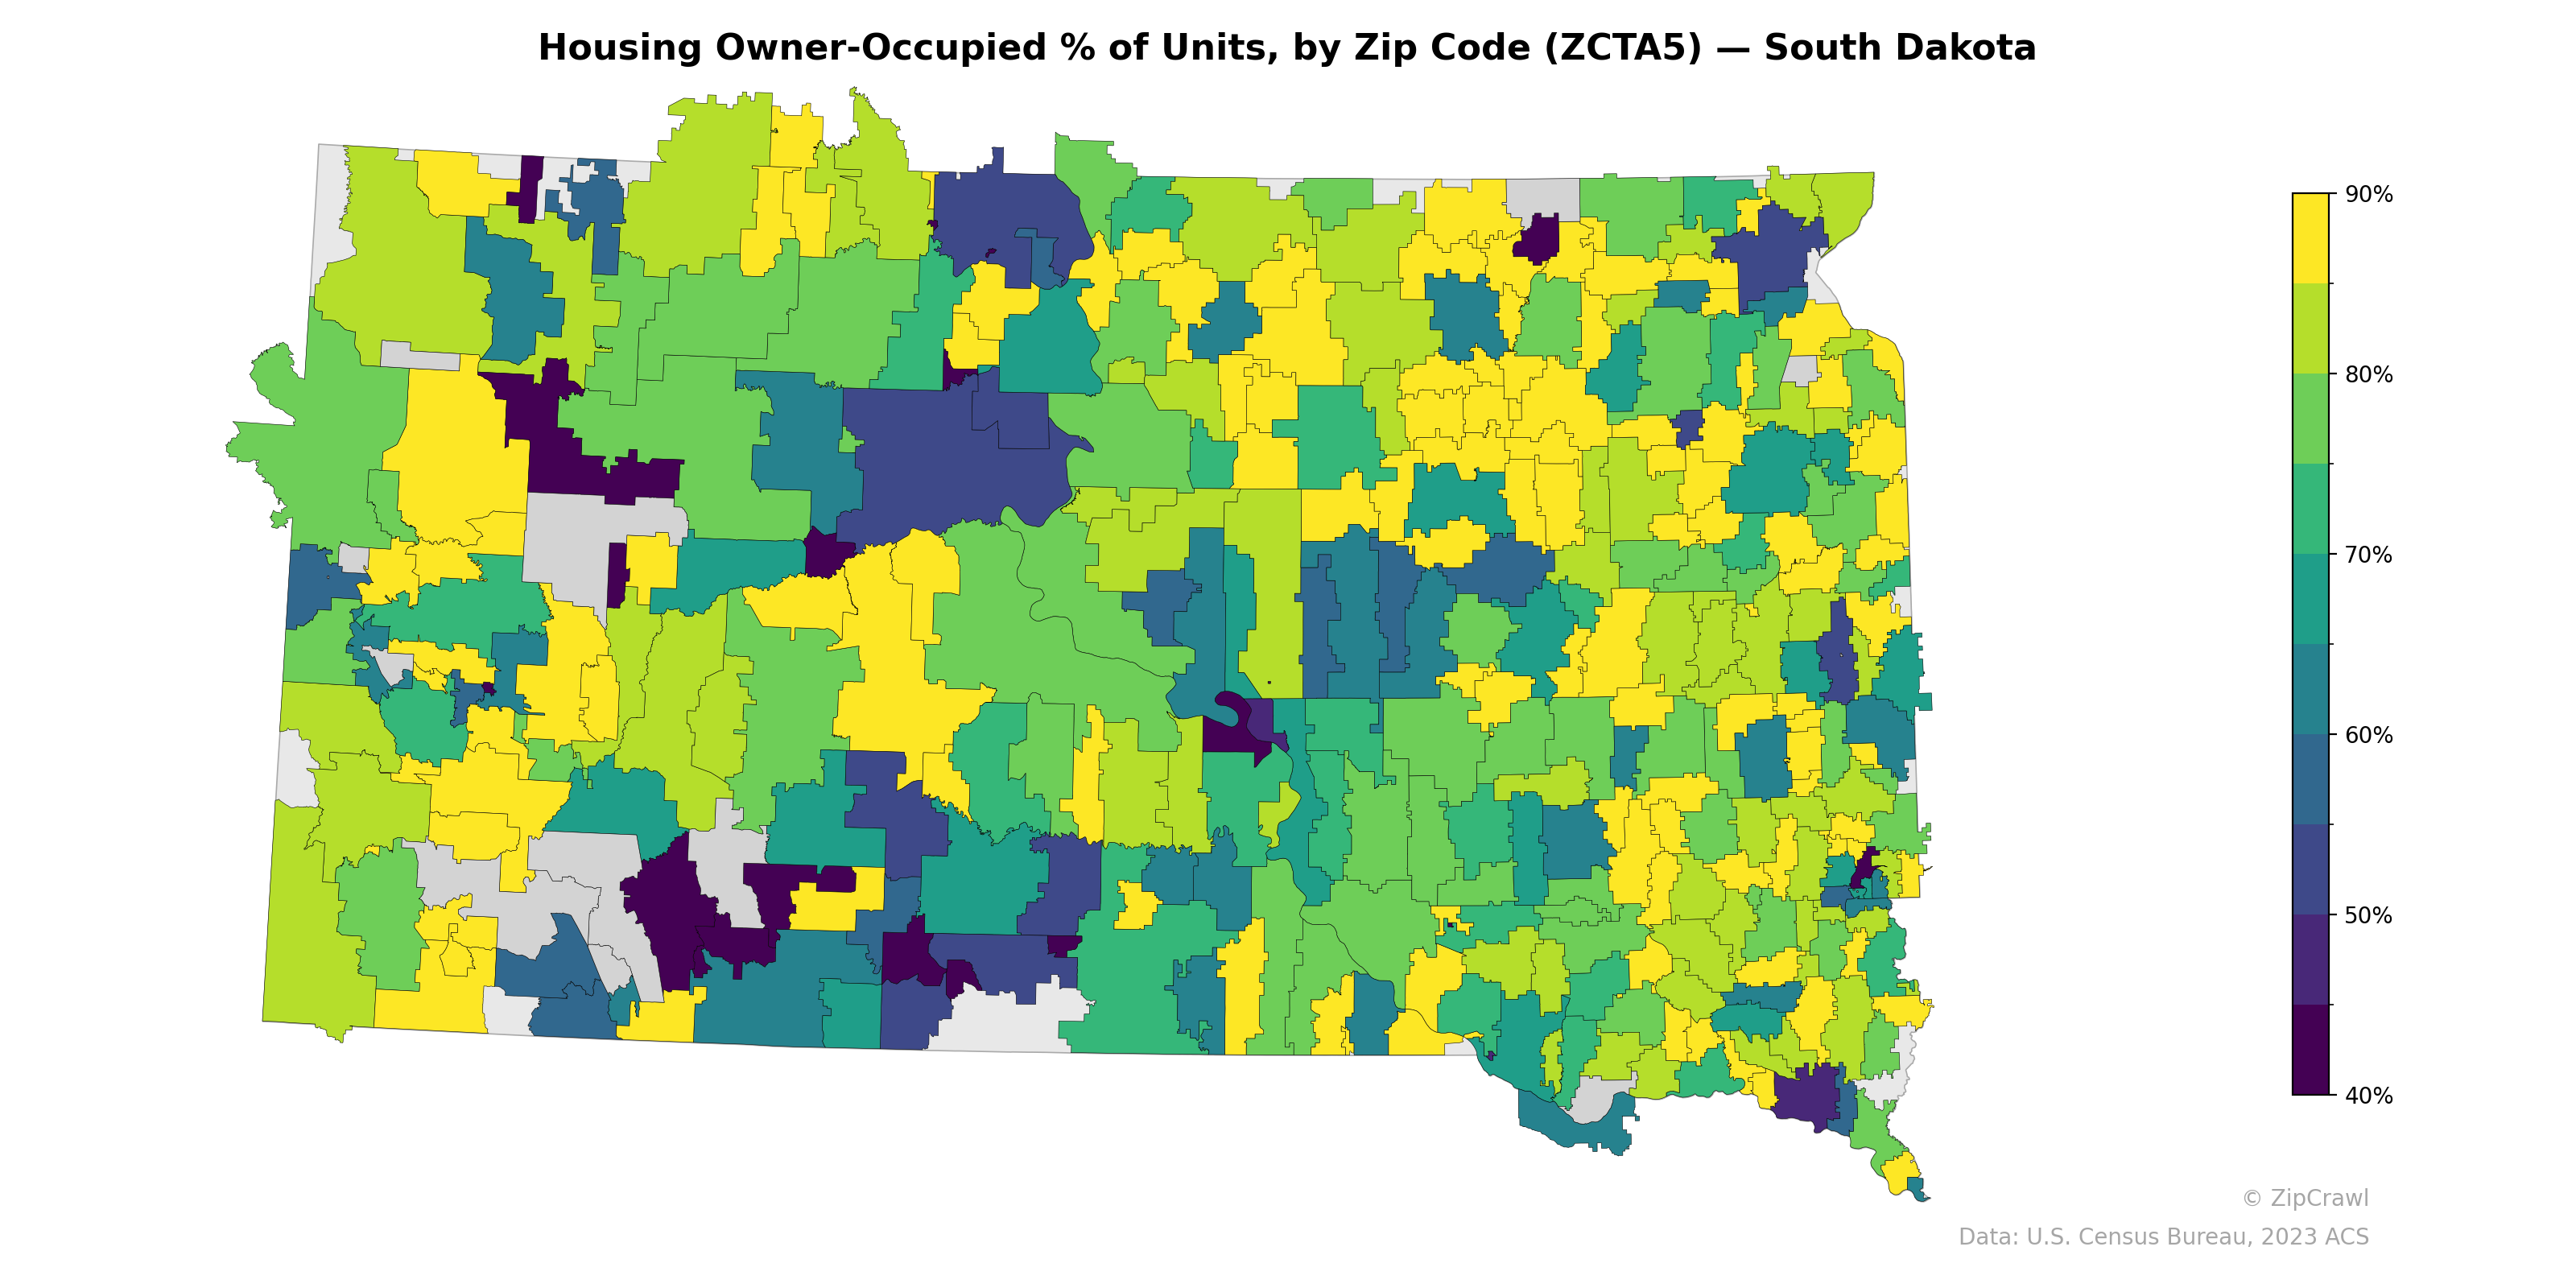
NOTE: Gray indicates insufficient data or a suppressed estimate.
Owner-occupancy rates across South Dakota zip codes display considerable variation, ranging from below 40% in several reservation areas—particularly in the south-central region near Pine Ridge and Rosebud—to above 90% in many rural zip codes scattered throughout the central and eastern portions of the state. The Sioux Falls metro area in the southeast and Rapid City in the west exhibit notably lower owner-occupancy rates compared to surrounding rural areas, consistent with higher renter concentrations in urban centers. A distinct east-west divide is also apparent, with western zip codes, especially those overlapping tribal lands, generally showing darker (lower) values, while the eastern agricultural heartland trends toward higher homeownership rates.
Data: U.S. Census Bureau, 2023 ACS
Explore
- Housing Owner-Occupied Median Value ($), by Zip Code (ZCTA5) — New York
- Household Average Size by Zip Code (ZCTA5) — South Dakota
- % of Households with Broadband Internet, by Zip Code (ZCTA5) — South Dakota
- Population Non-Hispanic American Indian % by Zip Code (ZCTA5) — South Dakota
- Housing Median Monthly Rent ($), by Zip Code (ZCTA5) — South Dakota
- Housing % of Units Built Since 2010, by Zip Code (ZCTA5) — South Dakota
- Housing Owner-Occupied Median Value ($), by Zip Code (ZCTA5) — South Dakota
- % of Population without Health Insurance, by Zip Code (ZCTA5) — South Dakota
- High School Graduate (% of Over 25) by Zip Code (ZCTA5) — South Dakota
- Bachelor's Degree or Higher (% of Over 25) by Zip Code (ZCTA5) — South Dakota
- Household Average Size by County
- Population Non-Hispanic White % by Zip Code (ZCTA5) — Indiana
- Married Couple (% of all Households) by Zip Code (ZCTA5) — New York
- Housing Median Monthly Rent ($), by Zip Code (ZCTA5) — New York
- % of Population without Health Insurance, by Zip Code (ZCTA5) — New York
- Housing % of Units Built Since 2010, by Zip Code (ZCTA5) — New York
- Housing Vacancy Rate by Zip Code (ZCTA5) — New York
- Population Non-Hispanic White % by Zip Code (ZCTA5) — New York
- Bachelor's Degree or Higher (% of Over 25) by Zip Code (ZCTA5) — New York
- % of Households with Broadband Internet, by Zip Code (ZCTA5) — New York
- Household Average Size by Zip Code (ZCTA5) — New York
- High School Graduate (% of Over 25) by Zip Code (ZCTA5) — Rhode Island
- Population Non-Hispanic American Indian % by Zip Code (ZCTA5) — North Dakota
- Housing Vacancy Rate by Zip Code (ZCTA5) — Rhode Island
- U.S. Citizens (% of Population Over 18) by Zip Code (ZCTA5) — Oregon
- Household Average Size by Zip Code (ZCTA5) — Rhode Island
- Population Non-Hispanic Black % by Zip Code (ZCTA5) — North Dakota
- Housing Vacancy Rate by Zip Code (ZCTA5) — Alaska
- Population Non-Hispanic American Indian % by Zip Code (ZCTA5) — Rhode Island
- Bachelor's Degree or Higher (% of Over 25) by Zip Code (ZCTA5) — Rhode Island
- Housing Owner-Occupied % of Units, by Zip Code (ZCTA5) — North Dakota
- Housing Owner-Occupied % of Units, by Zip Code (ZCTA5) — South Carolina
- Housing Owner-Occupied % of Units, by Zip Code (ZCTA5) — Ohio
- Housing Owner-Occupied % of Units, by Zip Code (ZCTA5) — Utah
- Housing Owner-Occupied % of Units, by Zip Code (ZCTA5) — Iowa
- Housing Owner-Occupied % of Units, by Zip Code (ZCTA5) — Minnesota
- Housing Owner-Occupied % of Units, by Zip Code (ZCTA5) — Texas
- Housing Owner-Occupied % of Units, by Zip Code (ZCTA5) — Oregon
- Housing Owner-Occupied % of Units, by Zip Code (ZCTA5) — Idaho
- Housing Owner-Occupied % of Units, by Zip Code (ZCTA5) — Hawaii