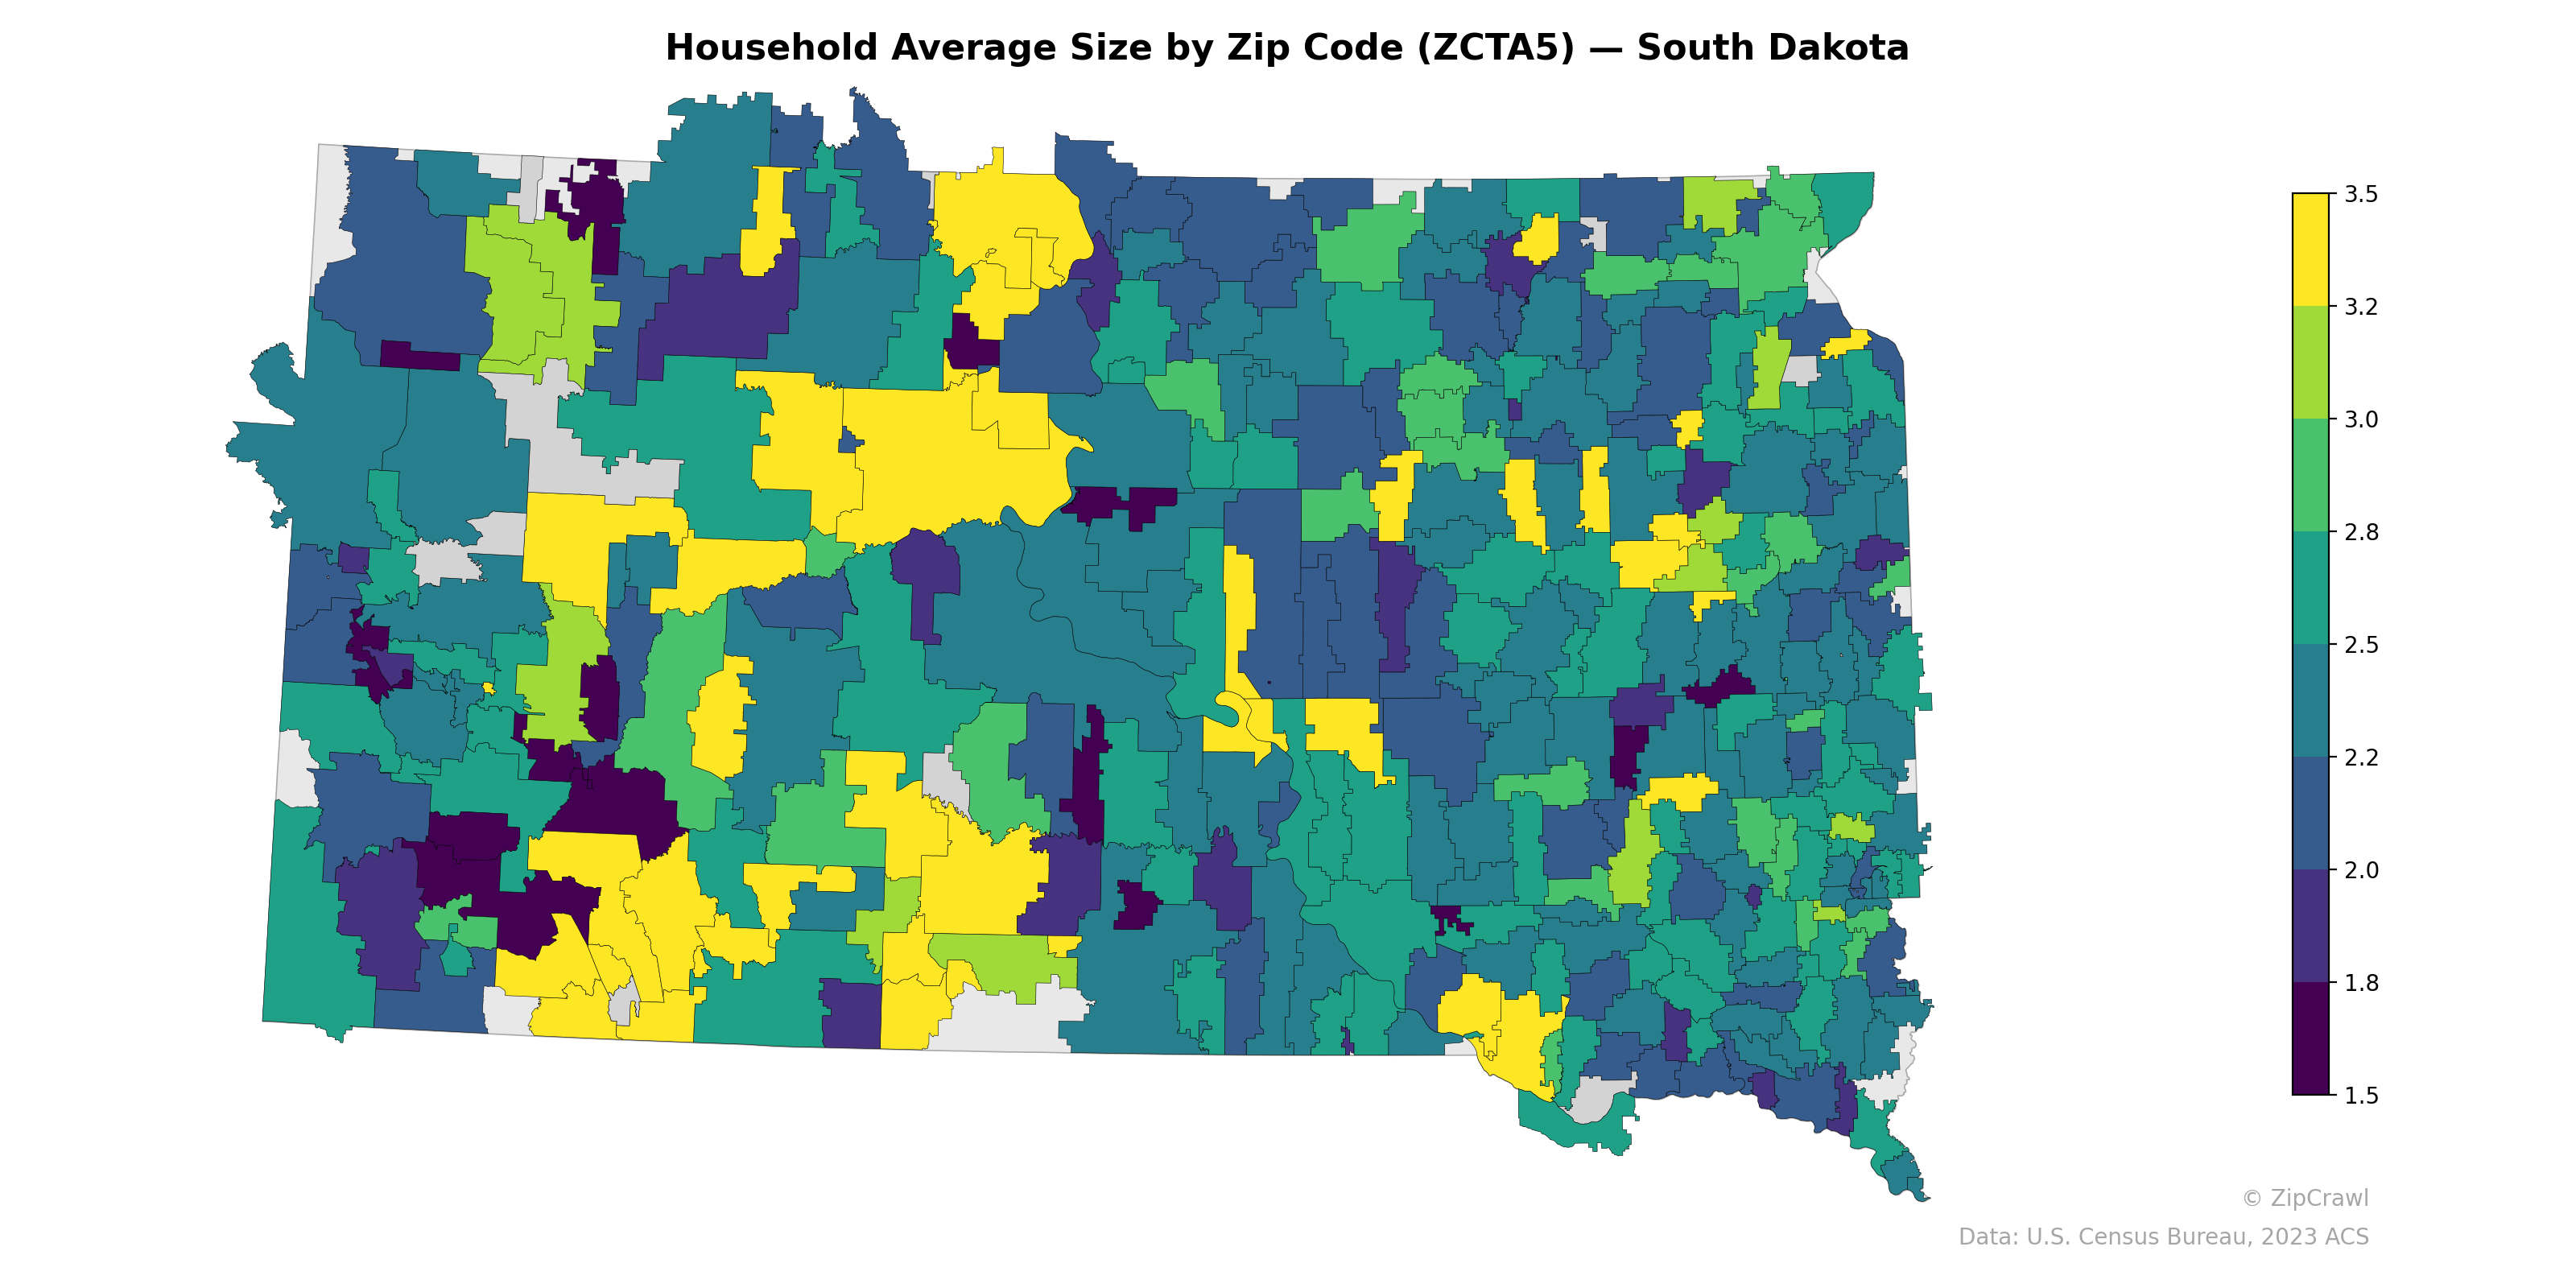
NOTE: Gray indicates insufficient data or a suppressed estimate.
Zip codes in the southwestern portion of South Dakota, particularly around the Pine Ridge and Rosebud reservation areas, display notably higher average household sizes exceeding 3.0, consistent with larger multigenerational households common in Native American communities. Urban centers such as Sioux Falls in the southeast and Rapid City in the west tend toward moderate values around 2.2–2.6, while scattered small-town and rural zip codes across the central and northern tiers show considerable variability, with some of the lowest values (below 1.8) likely reflecting aging populations or college-town demographics. The starkest contrasts appear in the west, where adjacent zip codes can differ by more than a full person per household, underscoring the demographic heterogeneity driven by reservation boundaries and rural settlement patterns.
Data: U.S. Census Bureau, 2023 ACS
Explore
- Housing Owner-Occupied Median Value ($), by Zip Code (ZCTA5) — New York
- Housing % of Units Built Since 2010, by Zip Code (ZCTA5) — South Dakota
- High School Graduate (% of Over 25) by Zip Code (ZCTA5) — South Dakota
- Housing Median Monthly Rent ($), by Zip Code (ZCTA5) — South Dakota
- Housing Owner-Occupied Median Value ($), by Zip Code (ZCTA5) — South Dakota
- % of Households with Broadband Internet, by Zip Code (ZCTA5) — South Dakota
- Housing Owner-Occupied % of Units, by Zip Code (ZCTA5) — South Dakota
- % of Population without Health Insurance, by Zip Code (ZCTA5) — South Dakota
- Bachelor's Degree or Higher (% of Over 25) by Zip Code (ZCTA5) — South Dakota
- Population Non-Hispanic American Indian % by Zip Code (ZCTA5) — South Dakota
- High School Graduate (% of Over 25) by Zip Code (ZCTA5) — Indiana
- Married Couple (% of all Households) by Zip Code (ZCTA5) — New York
- Housing Owner-Occupied % of Units, by Zip Code (ZCTA5) — New York
- % of Population without Health Insurance, by Zip Code (ZCTA5) — New York
- Housing Median Monthly Rent ($), by Zip Code (ZCTA5) — New York
- Housing Vacancy Rate by Zip Code (ZCTA5) — New York
- High School Graduate (% of Over 25) by Zip Code (ZCTA5) — New York
- Bachelor's Degree or Higher (% of Over 25) by Zip Code (ZCTA5) — New York
- Housing % of Units Built Since 2010, by Zip Code (ZCTA5) — New York
- % of Households with Broadband Internet, by Zip Code (ZCTA5) — New York
- Housing Vacancy Rate by Zip Code (ZCTA5) — Rhode Island
- High School Graduate (% of Over 25) by Zip Code (ZCTA5) — Rhode Island
- Population Non-Hispanic Asian % by Zip Code (ZCTA5) — Rhode Island
- U.S. Citizens (% of Population Over 18) by Zip Code (ZCTA5) — Oregon
- Housing % of Units Built Since 2010, by Zip Code (ZCTA5) — Rhode Island
- Population Non-Hispanic Black % by Zip Code (ZCTA5) — North Dakota
- Population Non-Hispanic American Indian % by Zip Code (ZCTA5) — North Dakota
- Housing Vacancy Rate by Zip Code (ZCTA5) — Alaska
- Population Non-Hispanic American Indian % by Zip Code (ZCTA5) — Rhode Island
- Bachelor's Degree or Higher (% of Over 25) by Zip Code (ZCTA5) — Rhode Island
- Household Average Size by Zip Code (ZCTA5) — North Dakota
- Household Average Size by Zip Code (ZCTA5) — South Carolina
- Household Average Size by Zip Code (ZCTA5) — Utah
- Household Average Size by Zip Code (ZCTA5) — Iowa
- Household Average Size by Zip Code (ZCTA5) — Ohio
- Household Average Size by Zip Code (ZCTA5) — Minnesota
- Household Average Size by Zip Code (ZCTA5) — Idaho
- Household Average Size by Zip Code (ZCTA5) — Hawaii
- Household Average Size by Zip Code (ZCTA5) — Texas
- Household Average Size by Zip Code (ZCTA5) — Maine