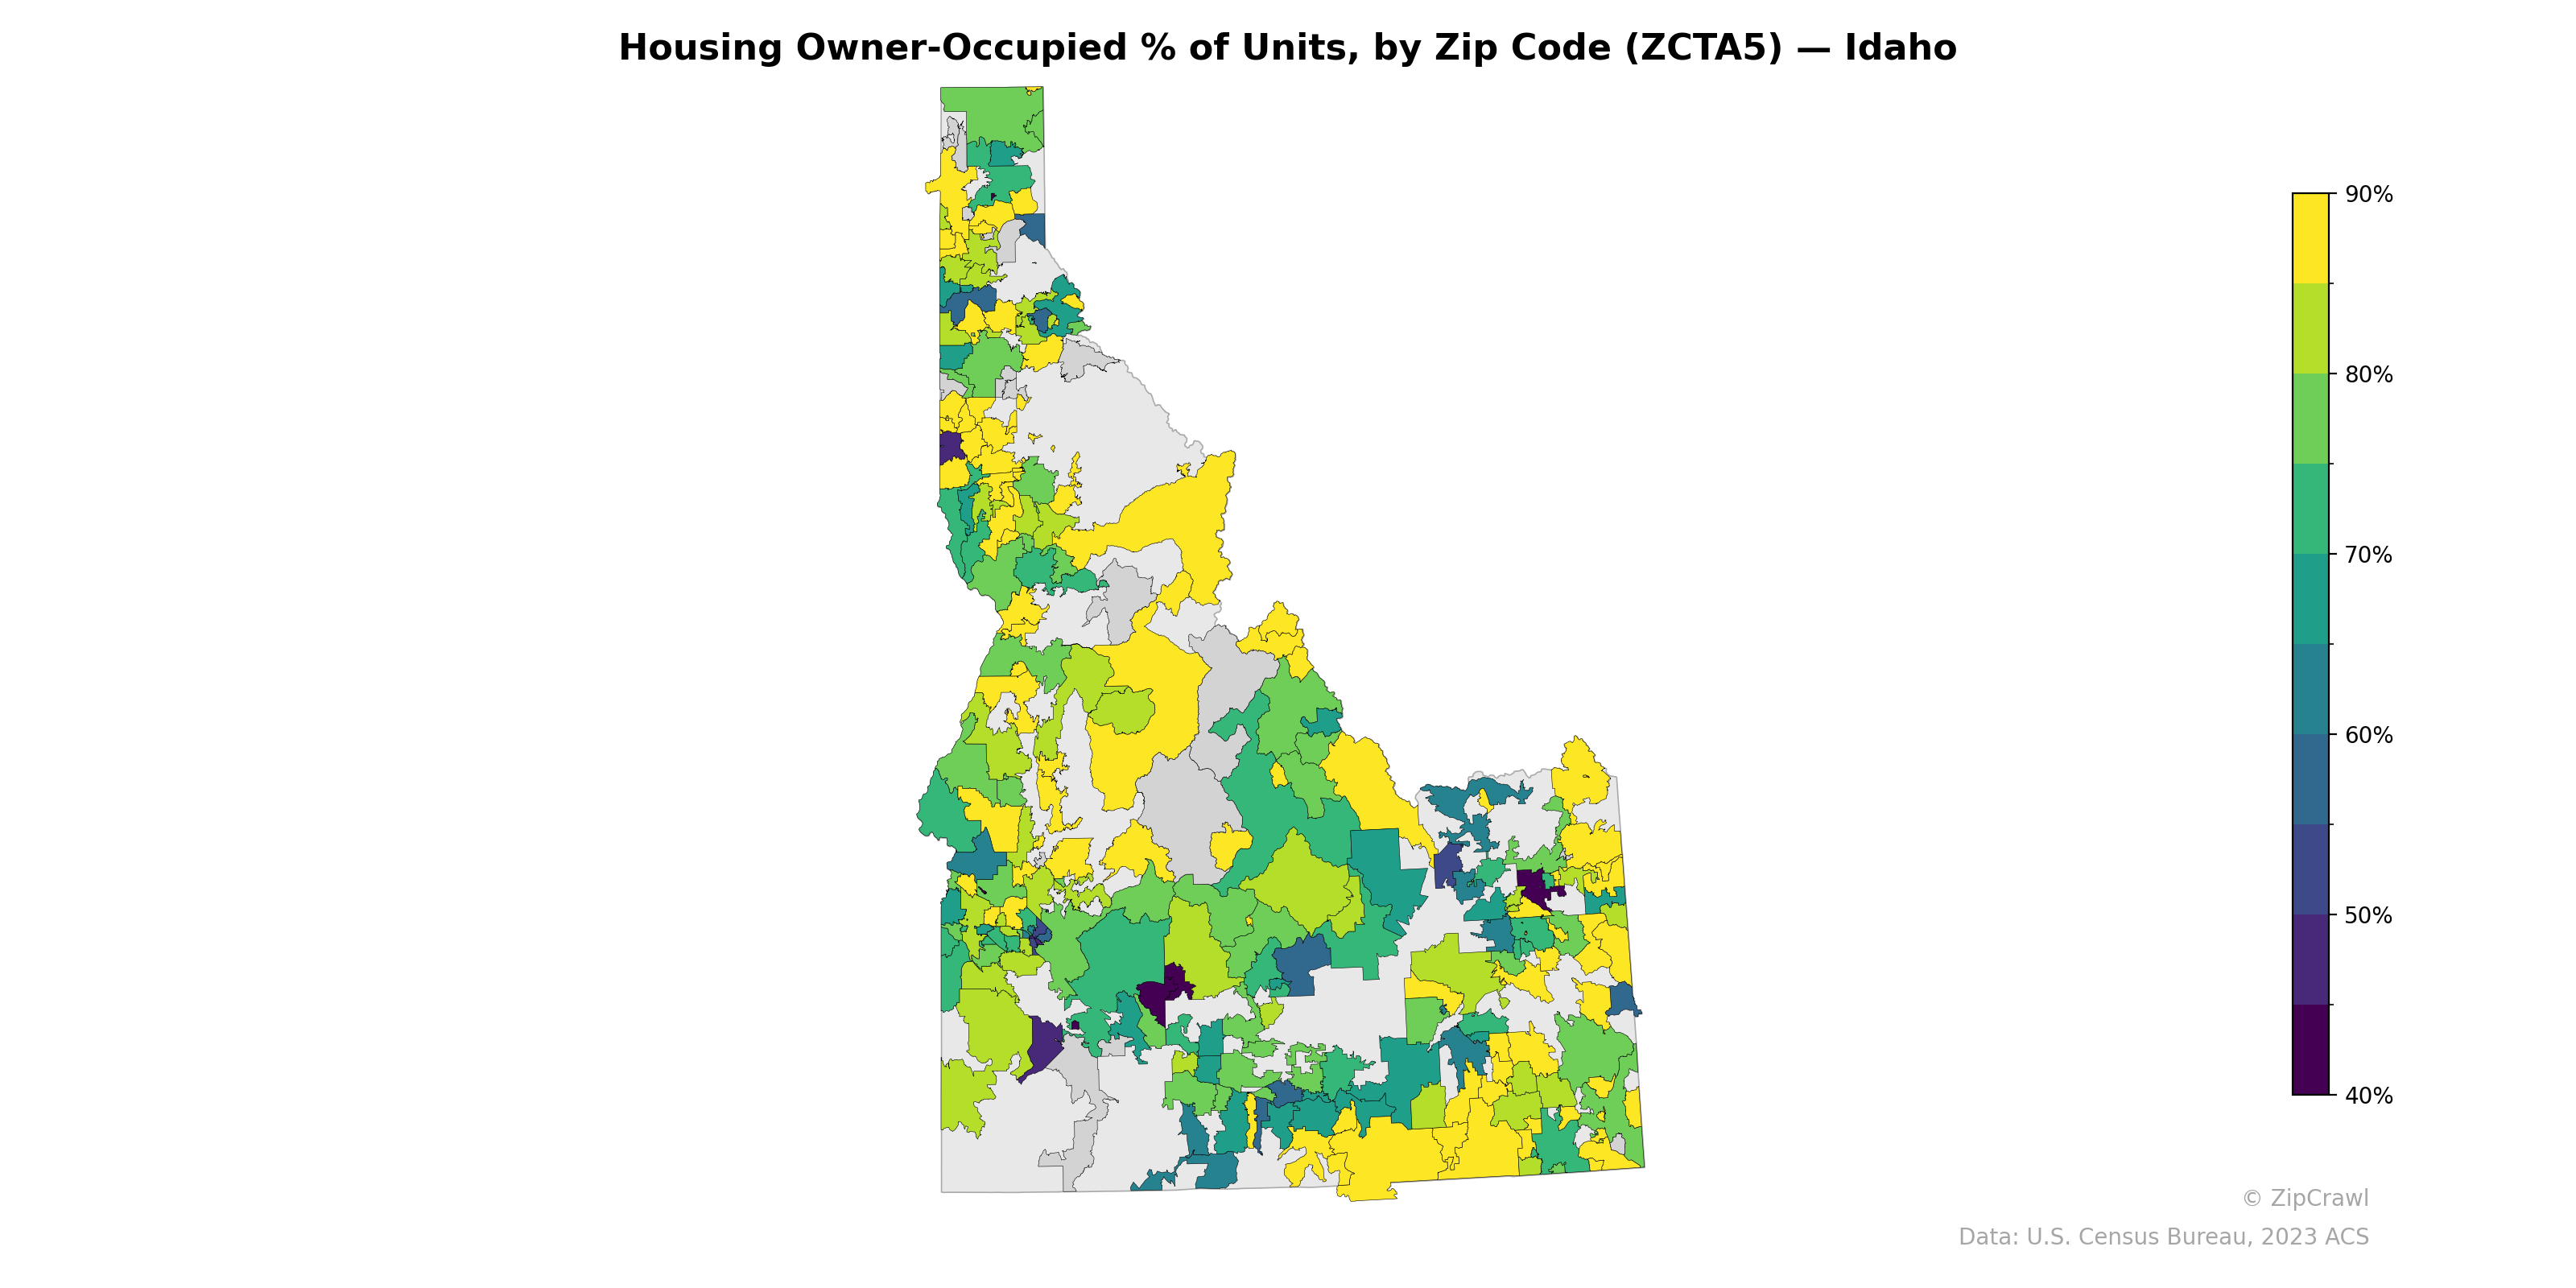
NOTE: Gray indicates insufficient data or a suppressed estimate.
Rural and exurban zip codes across central and southern Idaho consistently exhibit owner-occupancy rates above 80%, with particularly strong concentrations in the agricultural regions of the Magic Valley and upper Snake River Plain appearing in bright yellow. In contrast, urban cores—most notably the Boise metropolitan area in the southwest, Moscow in the north, and areas around Idaho Falls and Pocatello in the southeast—display markedly lower owner-occupancy rates dropping below 50%, reflecting higher concentrations of rental housing tied to university populations and denser urban development. The northern panhandle shows considerable heterogeneity, with teal- and blue-shaded zip codes around Coeur d'Alene and Kellogg interspersed among higher-ownership rural zones, suggesting localized pockets of renter-heavy housing markets in resort and former mining communities.
Data: U.S. Census Bureau, 2023 ACS
Explore
- Married Couple (% of all Households) by Zip Code (ZCTA5) — Florida
- Housing % of Units Built Since 2010, by Zip Code (ZCTA5) — Idaho
- Bachelor's Degree or Higher (% of Over 25) by Zip Code (ZCTA5) — Idaho
- Population Non-Hispanic American Indian % by Zip Code (ZCTA5) — Idaho
- Housing Median Monthly Rent ($), by Zip Code (ZCTA5) — Idaho
- Household Average Size by Zip Code (ZCTA5) — Idaho
- % of Population without Health Insurance, by Zip Code (ZCTA5) — Idaho
- % of Households with Broadband Internet, by Zip Code (ZCTA5) — Idaho
- Housing Owner-Occupied Median Value ($), by Zip Code (ZCTA5) — Idaho
- High School Graduate (% of Over 25) by Zip Code (ZCTA5) — Idaho
- Housing Median Monthly Rent ($), by County
- Population Non-Hispanic White % by Zip Code (ZCTA5) — Atlanta Metro
- Housing Vacancy Rate by Zip Code (ZCTA5) — Florida
- Housing Median Monthly Rent ($), by Zip Code (ZCTA5) — Florida
- Housing % of Units Built Since 2010, by Zip Code (ZCTA5) — Florida
- Housing Owner-Occupied Median Value ($), by Zip Code (ZCTA5) — Florida
- Household Average Size by Zip Code (ZCTA5) — Florida
- Population Non-Hispanic White % by Zip Code (ZCTA5) — Pennsylvania
- Bachelor's Degree or Higher (% of Over 25) by Zip Code (ZCTA5) — Florida
- % of Population without Health Insurance, by Zip Code (ZCTA5) — Florida
- % of Households with Broadband Internet, by Zip Code (ZCTA5) — Florida
- % of Population on Food Stamps or SNAP (Last 12 Months), by Zip Code (ZCTA5) — Mississippi
- % of Population without Health Insurance, by Zip Code (ZCTA5) — Mississippi
- U.S. Citizens (% of Population Over 18) by Zip Code (ZCTA5) — Kansas
- Median Age by Zip Code (ZCTA5) — Idaho
- Population Non-Hispanic American Indian % by Zip Code (ZCTA5) — Mississippi
- % of Households with Broadband Internet, by Zip Code (ZCTA5) — Mississippi
- Bachelor's Degree or Higher (% of Over 25) by Zip Code (ZCTA5) — Mississippi
- Population Non-Hispanic Asian % by Zip Code (ZCTA5) — Mississippi
- High School Graduate (% of Over 25) by Zip Code (ZCTA5) — Mississippi
- Housing Owner-Occupied % of Units, by Zip Code (ZCTA5) — Iowa
- Housing Owner-Occupied % of Units, by Zip Code (ZCTA5) — Ohio
- Housing Owner-Occupied % of Units, by Zip Code (ZCTA5) — Utah
- Housing Owner-Occupied % of Units, by Zip Code (ZCTA5) — Oklahoma
- Housing Owner-Occupied % of Units, by Zip Code (ZCTA5) — Indiana
- Housing Owner-Occupied % of Units, by Zip Code (ZCTA5) — Florida
- Housing Owner-Occupied % of Units, by Zip Code (ZCTA5) — Texas
- Housing Owner-Occupied % of Units, by Zip Code (ZCTA5) — Oregon
- Housing Owner-Occupied % of Units, by Zip Code (ZCTA5) — Hawaii
- Housing Owner-Occupied % of Units, by Zip Code (ZCTA5) — Maine