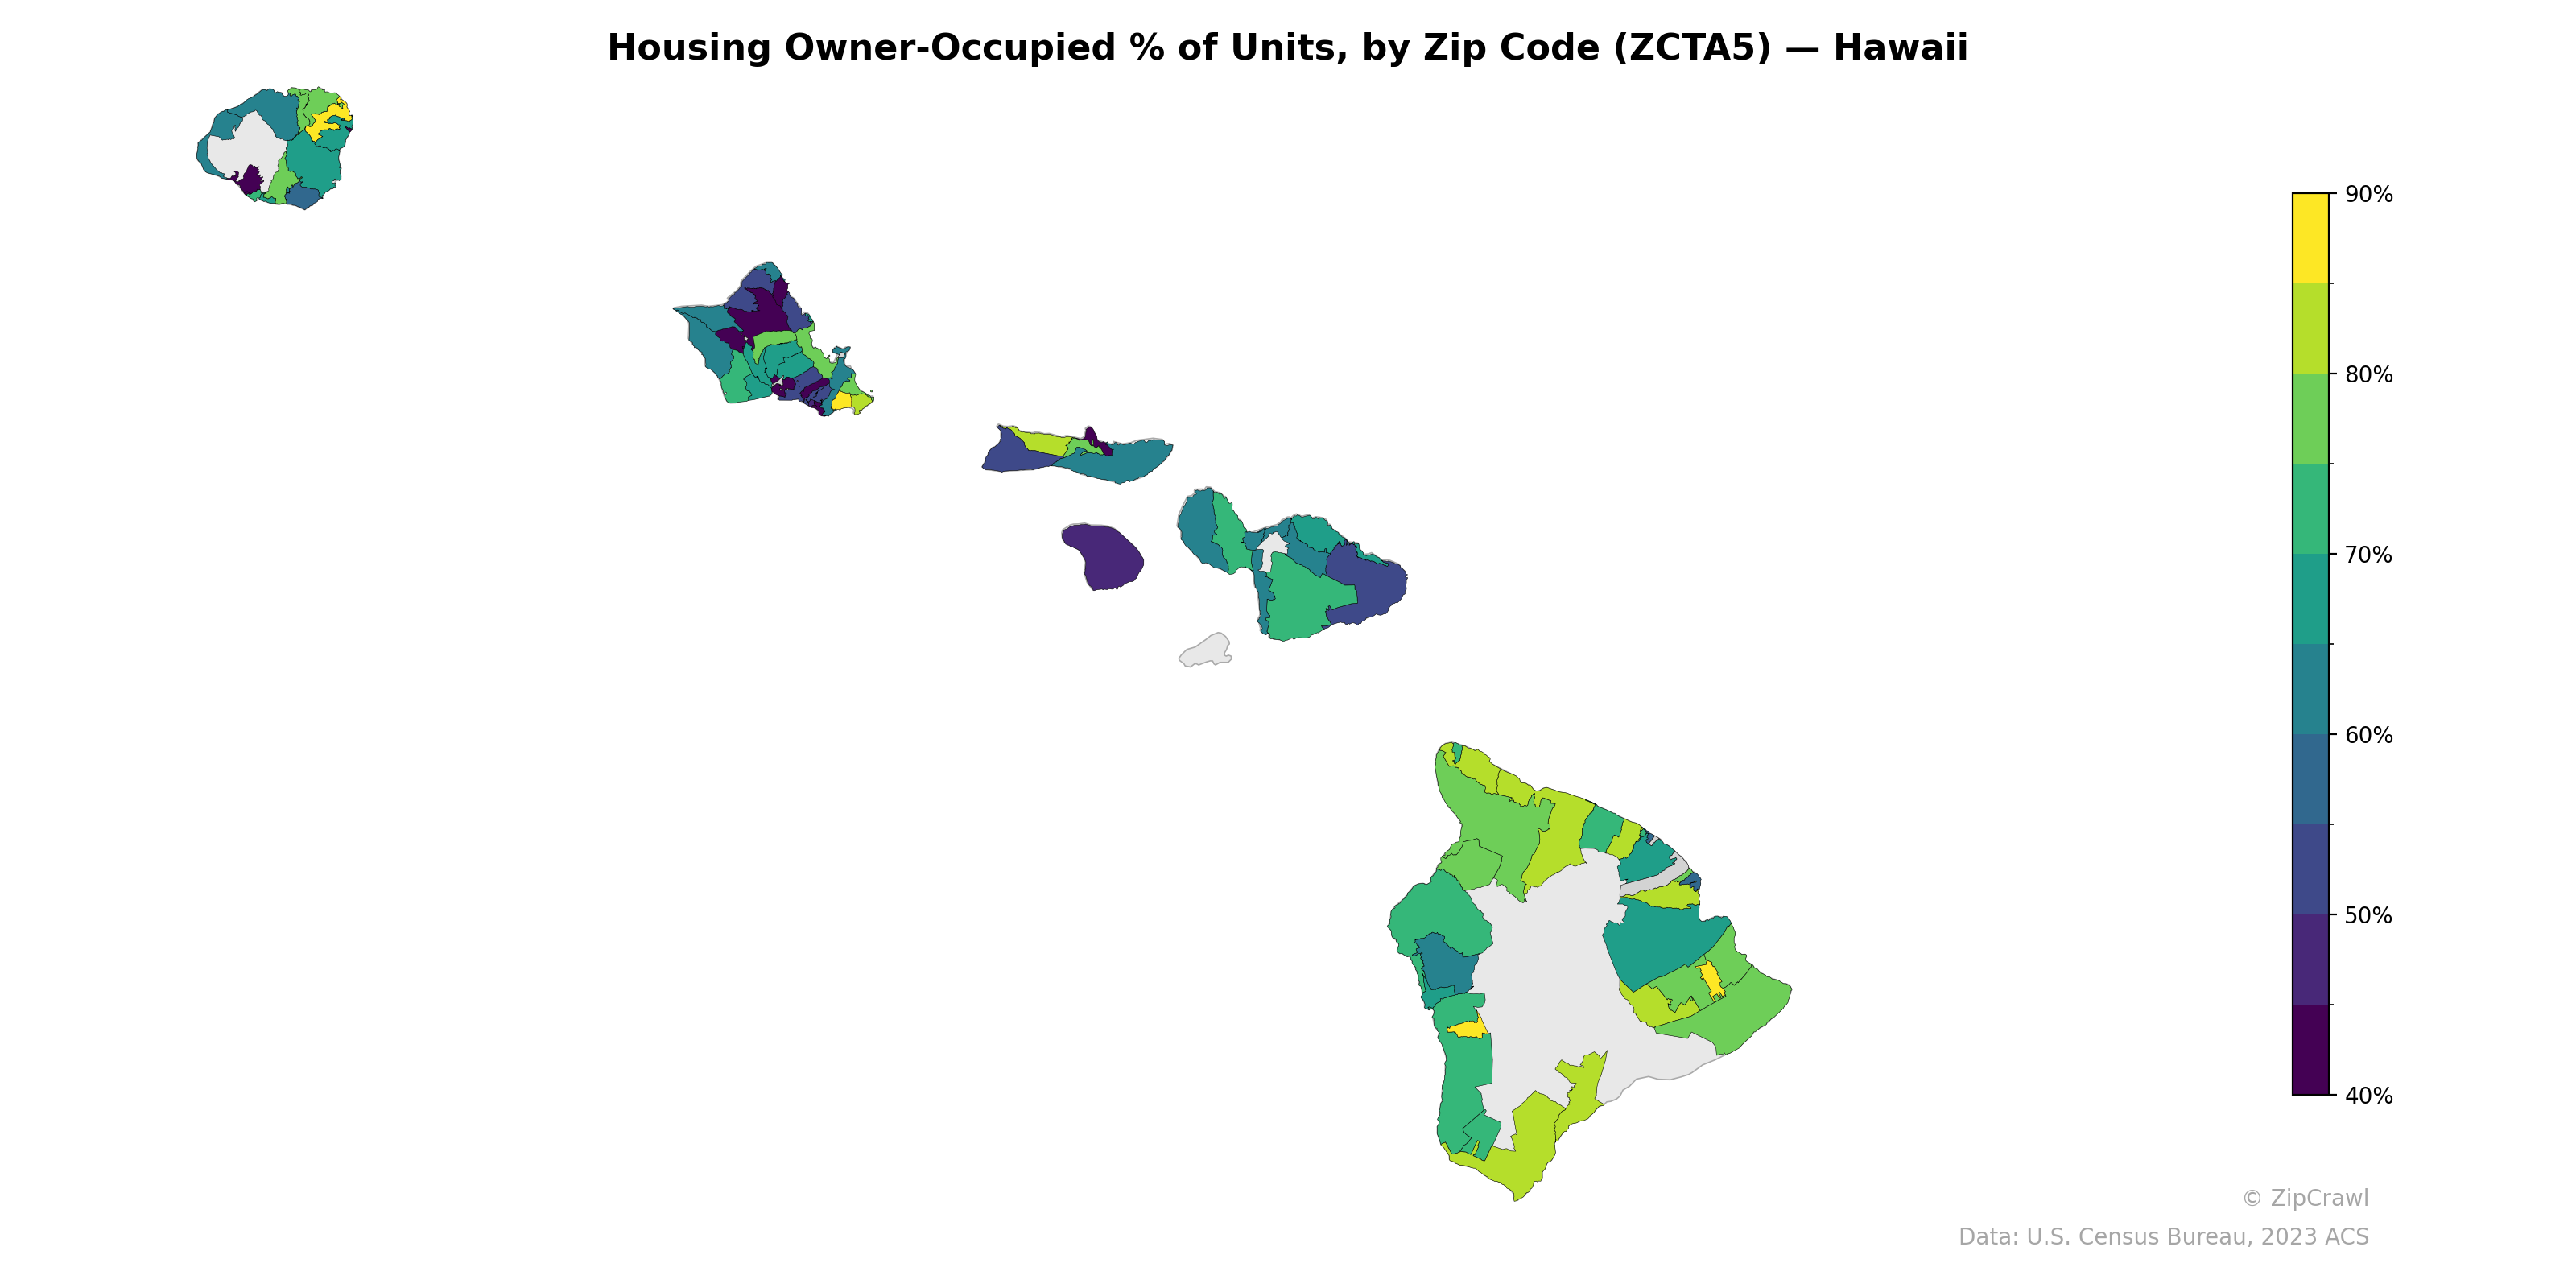
NOTE: Gray indicates insufficient data or a suppressed estimate.
Owner-occupancy rates across Hawaii's zip codes reveal a clear urban-rural divide, with Honolulu's dense urban core on O'ahu displaying some of the lowest rates (around 40–50%), while more rural and suburban areas on the Big Island's western coast and parts of Kaua'i reach 80–90%. Maui exhibits notable internal variation, with its resort-heavy western and southern zip codes showing lower owner-occupancy compared to more residential inland and upcountry areas. The Big Island's interior zip codes appear as missing data (gray), likely reflecting sparse population in volcanic and conservation lands, while its peripheral communities show moderately high homeownership in the 60–80% range.
Data: U.S. Census Bureau, 2023 ACS
Explore
- U.S. Citizens (% of Population Over 18) by Zip Code (ZCTA5) — New York
- Housing Median Monthly Rent ($), by Zip Code (ZCTA5) — Hawaii
- Population Non-Hispanic American Indian % by Zip Code (ZCTA5) — Hawaii
- Bachelor's Degree or Higher (% of Over 25) by Zip Code (ZCTA5) — Hawaii
- Housing % of Units Built Since 2010, by Zip Code (ZCTA5) — Hawaii
- Household Average Size by Zip Code (ZCTA5) — Hawaii
- Housing Owner-Occupied Median Value ($), by Zip Code (ZCTA5) — Hawaii
- % of Population without Health Insurance, by Zip Code (ZCTA5) — Hawaii
- % of Households with Broadband Internet, by Zip Code (ZCTA5) — Hawaii
- High School Graduate (% of Over 25) by Zip Code (ZCTA5) — Hawaii
- U.S. Citizens by County (% of Population Over 18)
- High School Graduate (% of Over 25) by Zip Code (ZCTA5) — New York
- Population Non-Hispanic White % by Zip Code (ZCTA5) — Phoenix Metro
- Population Non-Hispanic American Indian % by Zip Code (ZCTA5) — New York
- Median Age by Zip Code (ZCTA5) — New York
- % of Population on Food Stamps or SNAP (Last 12 Months), by Zip Code (ZCTA5) — Florida
- Population Non-Hispanic White % by Zip Code (ZCTA5) — New York
- Population Non-Hispanic White % by Zip Code (ZCTA5) — Florida
- Population Hispanic % by Zip Code (ZCTA5) — New York
- Population Non-Hispanic Asian % by Zip Code (ZCTA5) — Florida
- Population Non-Hispanic Black % by Zip Code (ZCTA5) — New York
- Household Median Income by Zip Code (ZCTA5) — New York
- Housing Vacancy Rate by Zip Code (ZCTA5) — West Virginia
- % of Households with Broadband Internet, by Zip Code (ZCTA5) — West Virginia
- Population Non-Hispanic Asian % by Zip Code (ZCTA5) — West Virginia
- Population Hispanic % by Zip Code (ZCTA5) — Hawaii
- High School Graduate (% of Over 25) by Zip Code (ZCTA5) — West Virginia
- Population Non-Hispanic American Indian % by Zip Code (ZCTA5) — West Virginia
- Bachelor's Degree or Higher (% of Over 25) by Zip Code (ZCTA5) — West Virginia
- % of Population without Health Insurance, by Zip Code (ZCTA5) — West Virginia
- Housing Owner-Occupied % of Units, by Zip Code (ZCTA5) — Utah
- Housing Owner-Occupied % of Units, by Zip Code (ZCTA5) — Ohio
- Housing Owner-Occupied % of Units, by Zip Code (ZCTA5) — Iowa
- Housing Owner-Occupied % of Units, by Zip Code (ZCTA5) — Idaho
- Housing Owner-Occupied % of Units, by Zip Code (ZCTA5) — Texas
- Housing Owner-Occupied % of Units, by Zip Code (ZCTA5) — Oregon
- Housing Owner-Occupied % of Units, by Zip Code (ZCTA5) — Wyoming
- Housing Owner-Occupied % of Units, by Zip Code (ZCTA5) — Maine
- Housing Owner-Occupied % of Units, by Zip Code (ZCTA5) — Delaware
- Housing Owner-Occupied % of Units, by Zip Code (ZCTA5) — Nevada