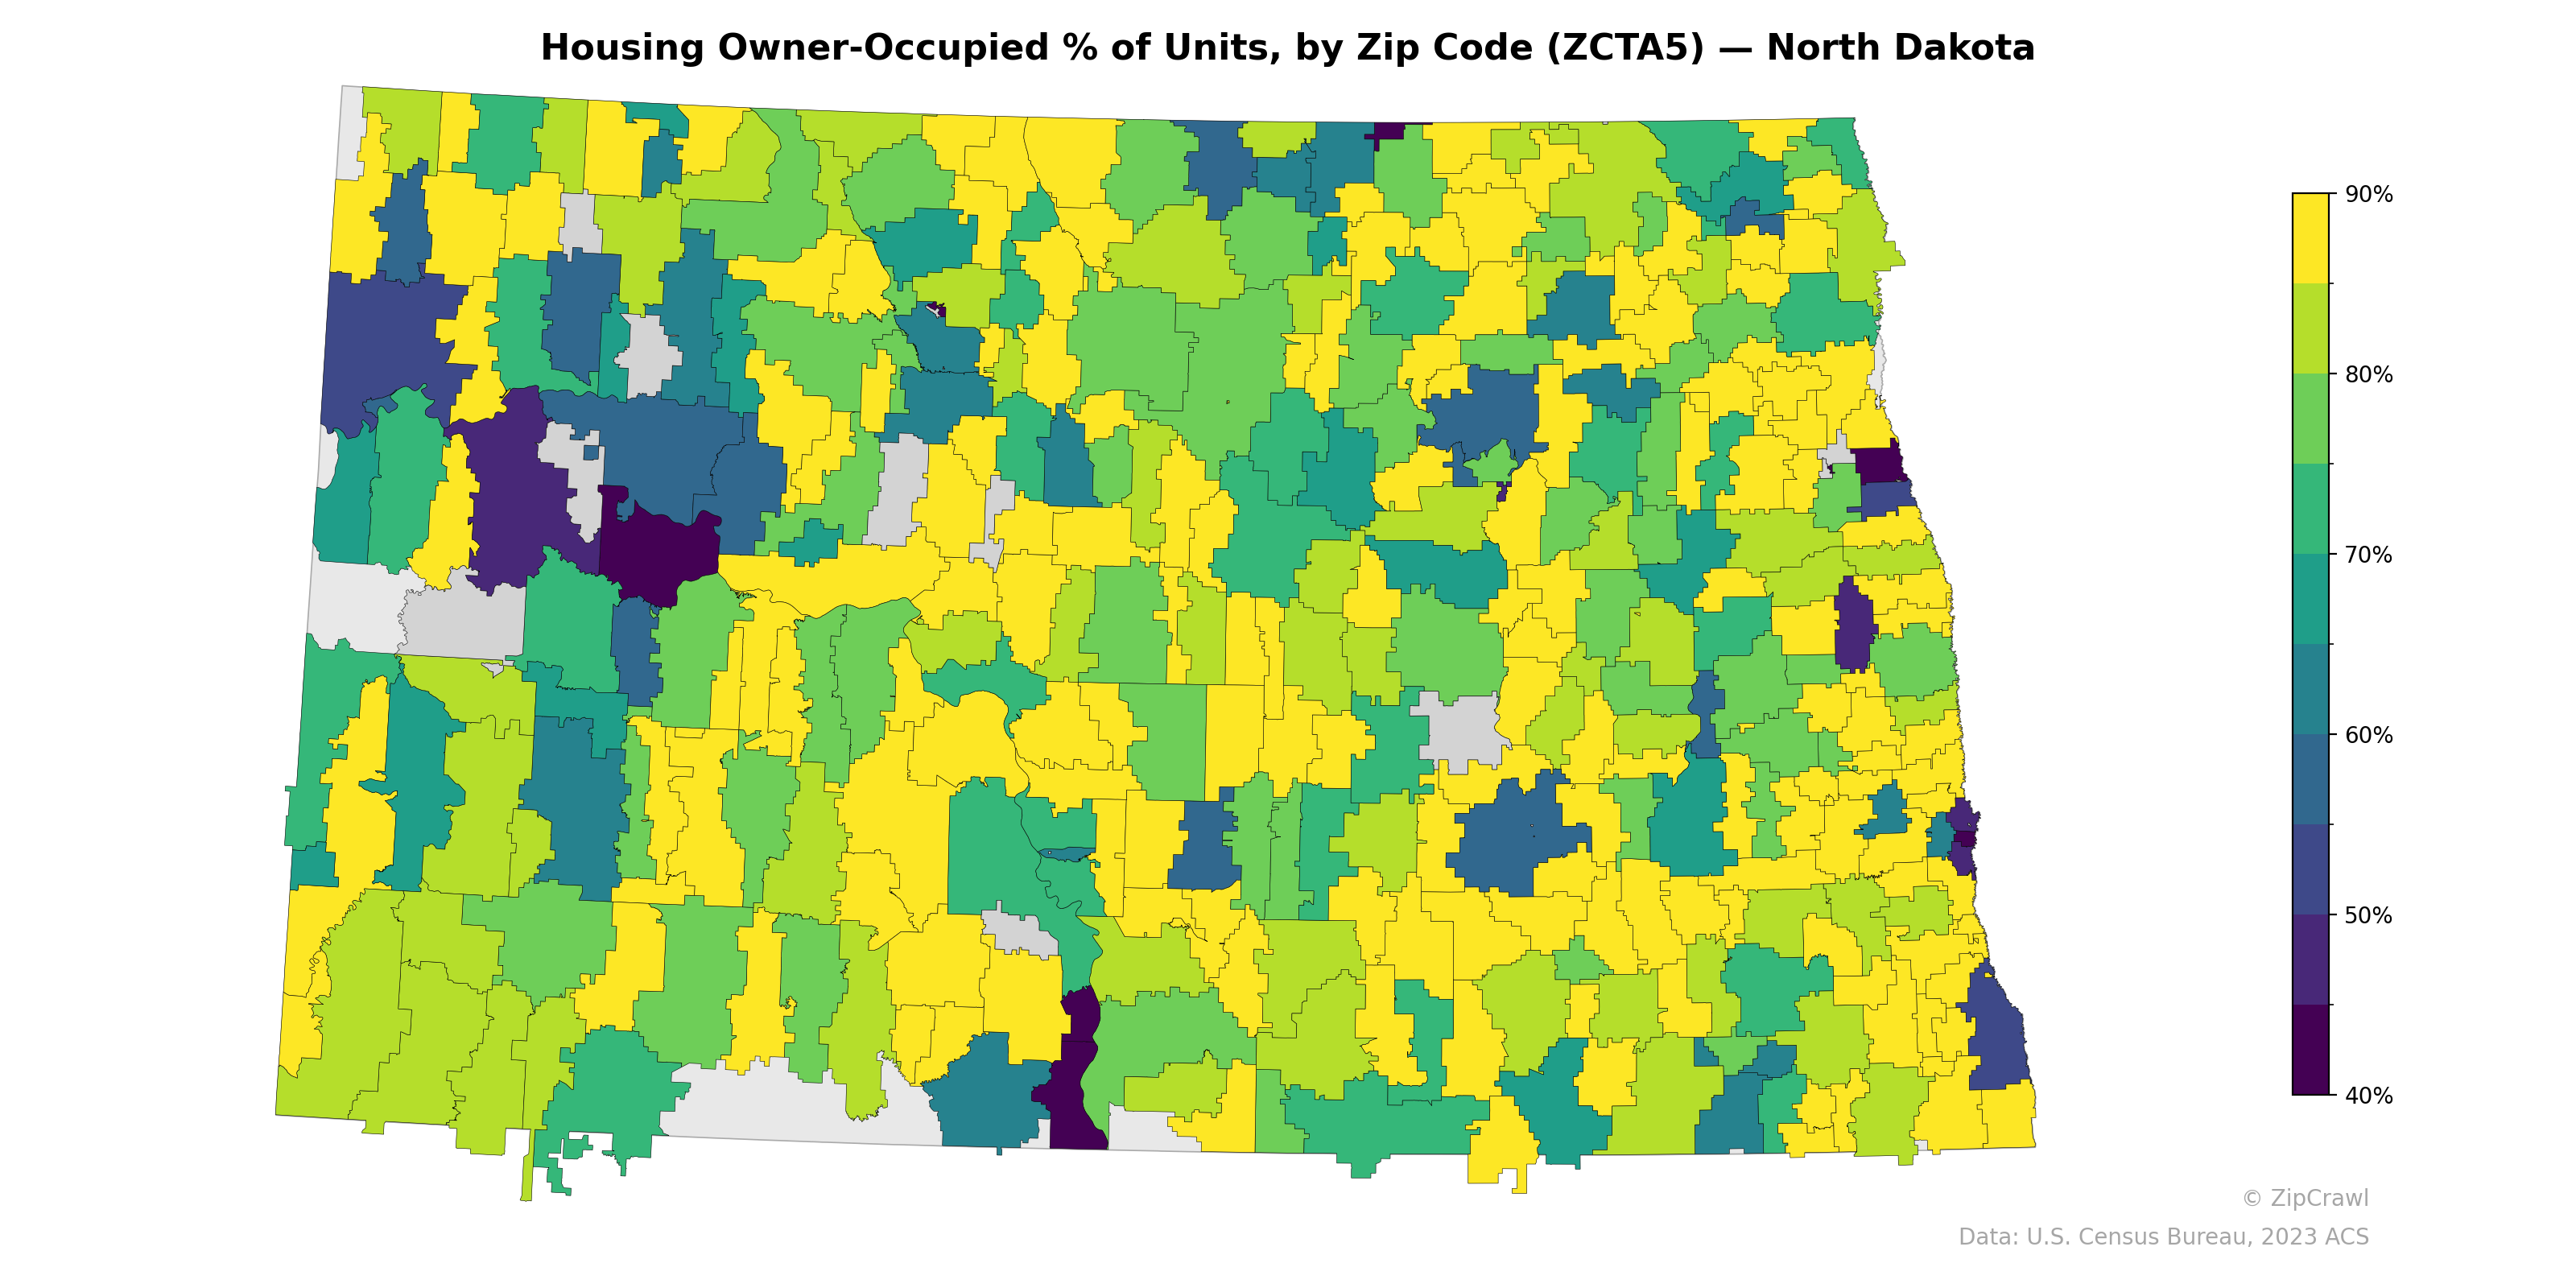
NOTE: Gray indicates insufficient data or a suppressed estimate.
Owner-occupancy rates across North Dakota display a strong urban-rural divide, with zip codes in the western part of the state—particularly around the Williston oil patch region—showing notably lower owner-occupancy rates (dark purple/teal, below 50%), likely reflecting the influx of transient energy workers relying on rental housing. Rural agricultural zip codes in the central and eastern portions of the state consistently exhibit the highest owner-occupancy rates, frequently exceeding 85%, while mid-sized population centers such as Fargo (southeast corner), Grand Forks (east-central border), and Bismarck (south-central) show moderate rates in the 55–70% range typical of college towns and regional hubs with larger renter populations. The scattered gray areas indicating missing data appear concentrated in sparsely populated western regions and tribal lands, where small sample sizes may limit reliable estimation.
Data: U.S. Census Bureau, 2023 ACS
Explore
- Housing % of Units Built Since 2010, by Zip Code (ZCTA5) — New York
- % of Population without Health Insurance, by Zip Code (ZCTA5) — North Dakota
- High School Graduate (% of Over 25) by Zip Code (ZCTA5) — North Dakota
- Bachelor's Degree or Higher (% of Over 25) by Zip Code (ZCTA5) — North Dakota
- Household Average Size by Zip Code (ZCTA5) — North Dakota
- Housing % of Units Built Since 2010, by Zip Code (ZCTA5) — North Dakota
- Housing Median Monthly Rent ($), by Zip Code (ZCTA5) — North Dakota
- Housing Owner-Occupied Median Value ($), by Zip Code (ZCTA5) — North Dakota
- Population Non-Hispanic American Indian % by Zip Code (ZCTA5) — North Dakota
- % of Households with Broadband Internet, by Zip Code (ZCTA5) — North Dakota
- Household Average Size by County
- Population Non-Hispanic White % by Zip Code (ZCTA5) — Illinois
- Population Non-Hispanic White % by Zip Code (ZCTA5) — Missouri
- Housing Median Monthly Rent ($), by Zip Code (ZCTA5) — New York
- Housing Owner-Occupied Median Value ($), by Zip Code (ZCTA5) — New York
- Household Average Size by Zip Code (ZCTA5) — New York
- Housing Vacancy Rate by Zip Code (ZCTA5) — New York
- Bachelor's Degree or Higher (% of Over 25) by Zip Code (ZCTA5) — New York
- % of Households with Broadband Internet, by Zip Code (ZCTA5) — New York
- % of Population without Health Insurance, by Zip Code (ZCTA5) — New York
- Married Couple (% of all Households) by Zip Code (ZCTA5) — New York
- High School Graduate (% of Over 25) by Zip Code (ZCTA5) — Rhode Island
- Housing Vacancy Rate by Zip Code (ZCTA5) — Alaska
- Housing Vacancy Rate by Zip Code (ZCTA5) — Rhode Island
- Bachelor's Degree or Higher (% of Over 25) by Zip Code (ZCTA5) — Rhode Island
- Median Age by Zip Code (ZCTA5) — Oregon
- Household Average Size by Zip Code (ZCTA5) — Rhode Island
- Population Non-Hispanic Black % by Zip Code (ZCTA5) — North Dakota
- Population Non-Hispanic American Indian % by Zip Code (ZCTA5) — Rhode Island
- Married Couple (% of all Households) by Zip Code (ZCTA5) — Rhode Island
- Housing Owner-Occupied % of Units, by Zip Code (ZCTA5) — South Dakota
- Housing Owner-Occupied % of Units, by Zip Code (ZCTA5) — North Carolina
- Housing Owner-Occupied % of Units, by Zip Code (ZCTA5) — Ohio
- Housing Owner-Occupied % of Units, by Zip Code (ZCTA5) — Utah
- Housing Owner-Occupied % of Units, by Zip Code (ZCTA5) — Nevada
- Housing Owner-Occupied % of Units, by Zip Code (ZCTA5) — Iowa
- Housing Owner-Occupied % of Units, by Zip Code (ZCTA5) — Minnesota
- Housing Owner-Occupied % of Units, by Zip Code (ZCTA5) — Texas
- Housing Owner-Occupied % of Units, by Zip Code (ZCTA5) — Oregon
- Housing Owner-Occupied % of Units, by Zip Code (ZCTA5) — Idaho