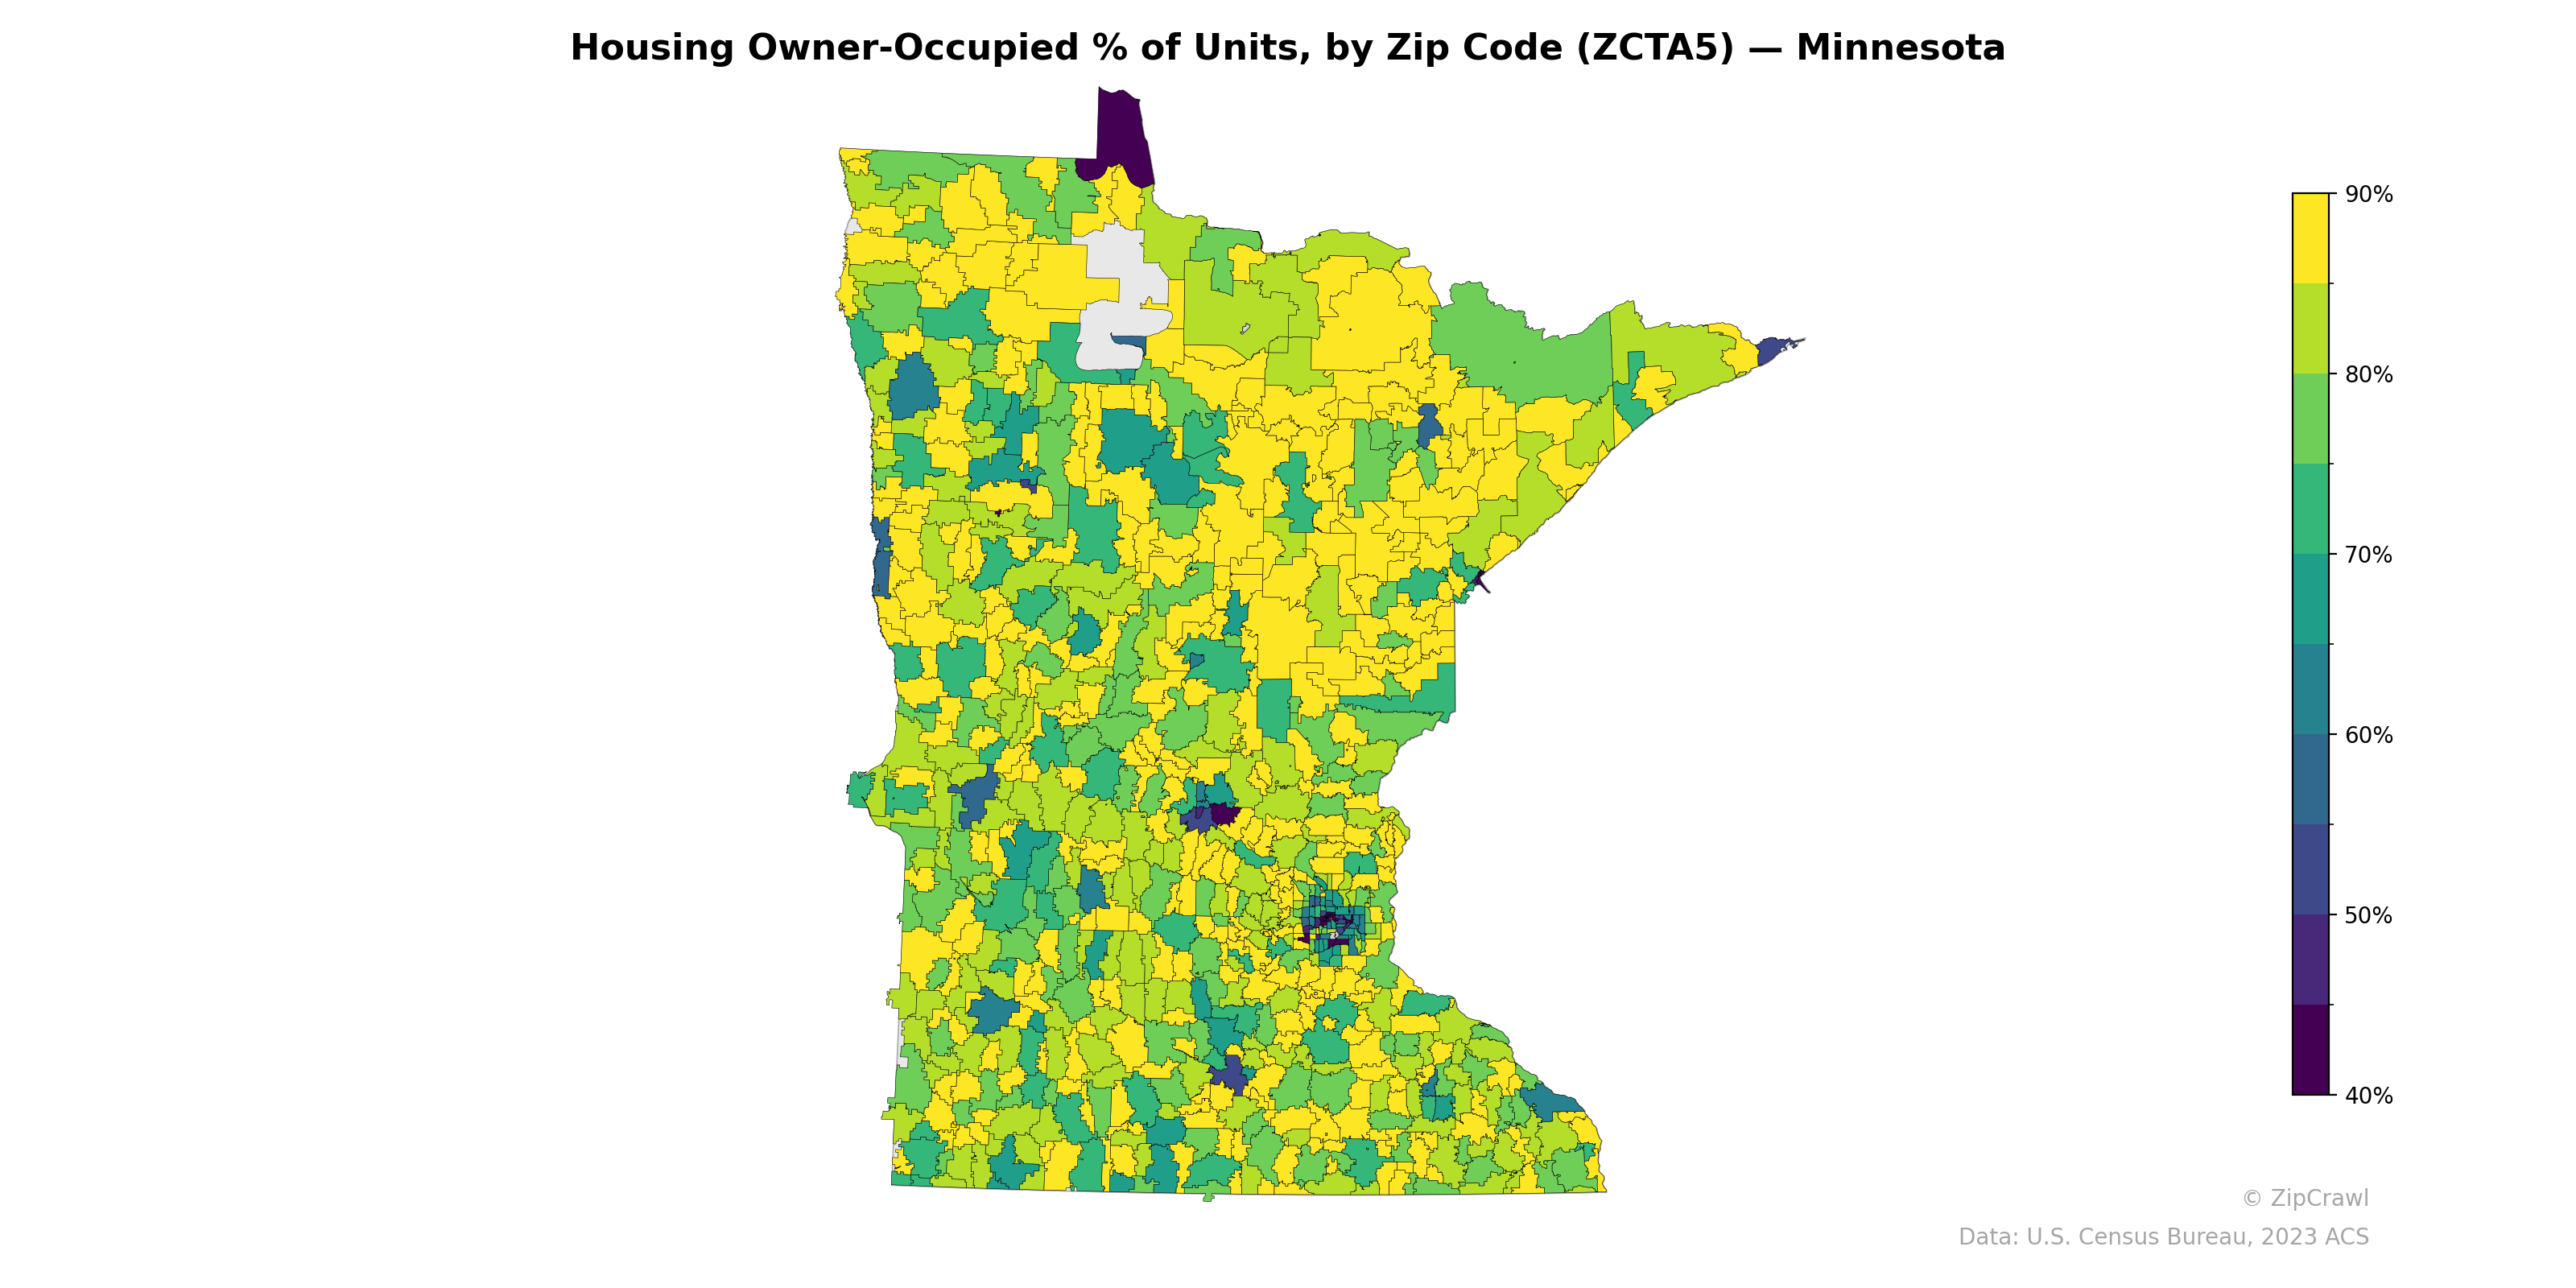
NOTE: Gray indicates insufficient data or a suppressed estimate.
Owner-occupancy rates across Minnesota zip codes generally exceed 80% in rural and exurban areas, particularly in the southern agricultural regions and portions of the northwest, where yellow hues dominate. The Twin Cities metropolitan area stands out as a pronounced cluster of lower owner-occupancy rates, with several Minneapolis and St. Paul zip codes dropping below 50%, reflecting dense rental markets in the urban core. Additional pockets of lower homeownership appear in regional centers such as Duluth, St. Cloud, and Mankato, as well as in northern zip codes that likely correspond to tribal lands and resort communities with seasonal housing stock.
Data: U.S. Census Bureau, 2023 ACS
Explore
- % of Population without Health Insurance, by Zip Code (ZCTA5) — Texas
- Bachelor's Degree or Higher (% of Over 25) by Zip Code (ZCTA5) — Minnesota
- % of Households with Broadband Internet, by Zip Code (ZCTA5) — Minnesota
- Population Non-Hispanic American Indian % by Zip Code (ZCTA5) — Minnesota
- Housing Owner-Occupied Median Value ($), by Zip Code (ZCTA5) — Minnesota
- Housing Median Monthly Rent ($), by Zip Code (ZCTA5) — Minnesota
- High School Graduate (% of Over 25) by Zip Code (ZCTA5) — Minnesota
- % of Population without Health Insurance, by Zip Code (ZCTA5) — Minnesota
- Household Average Size by Zip Code (ZCTA5) — Minnesota
- Housing % of Units Built Since 2010, by Zip Code (ZCTA5) — Minnesota
- Bachelor's Degree or Higher (% of Over 25) by County
- Household Average Size by Zip Code (ZCTA5) — Texas
- Housing Owner-Occupied Median Value ($), by Zip Code (ZCTA5) — Texas
- Housing % of Units Built Since 2010, by Zip Code (ZCTA5) — Texas
- Bachelor's Degree or Higher (% of Over 25) by Zip Code (ZCTA5) — Texas
- Housing Vacancy Rate by Zip Code (ZCTA5) — Texas
- Housing Median Monthly Rent ($), by Zip Code (ZCTA5) — Texas
- % of Households with Broadband Internet, by Zip Code (ZCTA5) — Texas
- Population Hispanic % by Zip Code (ZCTA5) — New York Metro
- Married Couple (% of all Households) by Zip Code (ZCTA5) — Texas
- % of Population on Food Stamps or SNAP (Last 12 Months), by Zip Code (ZCTA5) — Wisconsin
- High School Graduate (% of Over 25) by Zip Code (ZCTA5) — Wisconsin
- U.S. Citizens (% of Population Over 18) by Zip Code (ZCTA5) — Colorado
- Population Non-Hispanic American Indian % by Zip Code (ZCTA5) — Wisconsin
- Population Non-Hispanic Black % by Zip Code (ZCTA5) — Wisconsin
- Population Non-Hispanic White % by Zip Code (ZCTA5) — Wisconsin
- Household Median Income by Zip Code (ZCTA5) — Colorado
- Bachelor's Degree or Higher (% of Over 25) by Zip Code (ZCTA5) — Wisconsin
- Married Couple (% of all Households) by Zip Code (ZCTA5) — Wisconsin
- Median Age by Zip Code (ZCTA5) — Wisconsin
- Housing Owner-Occupied % of Units, by Zip Code (ZCTA5) — Wyoming
- Housing Owner-Occupied % of Units, by Zip Code (ZCTA5) — Maine
- Housing Owner-Occupied % of Units, by Zip Code (ZCTA5) — Ohio
- Housing Owner-Occupied % of Units, by Zip Code (ZCTA5) — Utah
- Housing Owner-Occupied % of Units, by Zip Code (ZCTA5) — Michigan
- Housing Owner-Occupied % of Units, by Zip Code (ZCTA5) — Missouri
- Housing Owner-Occupied % of Units, by Zip Code (ZCTA5) — Iowa
- Housing Owner-Occupied % of Units, by Zip Code (ZCTA5) — Tennessee
- Housing Owner-Occupied % of Units, by Zip Code (ZCTA5) — Mississippi
- Housing Owner-Occupied % of Units, by Zip Code (ZCTA5) — Minneapolis Metro