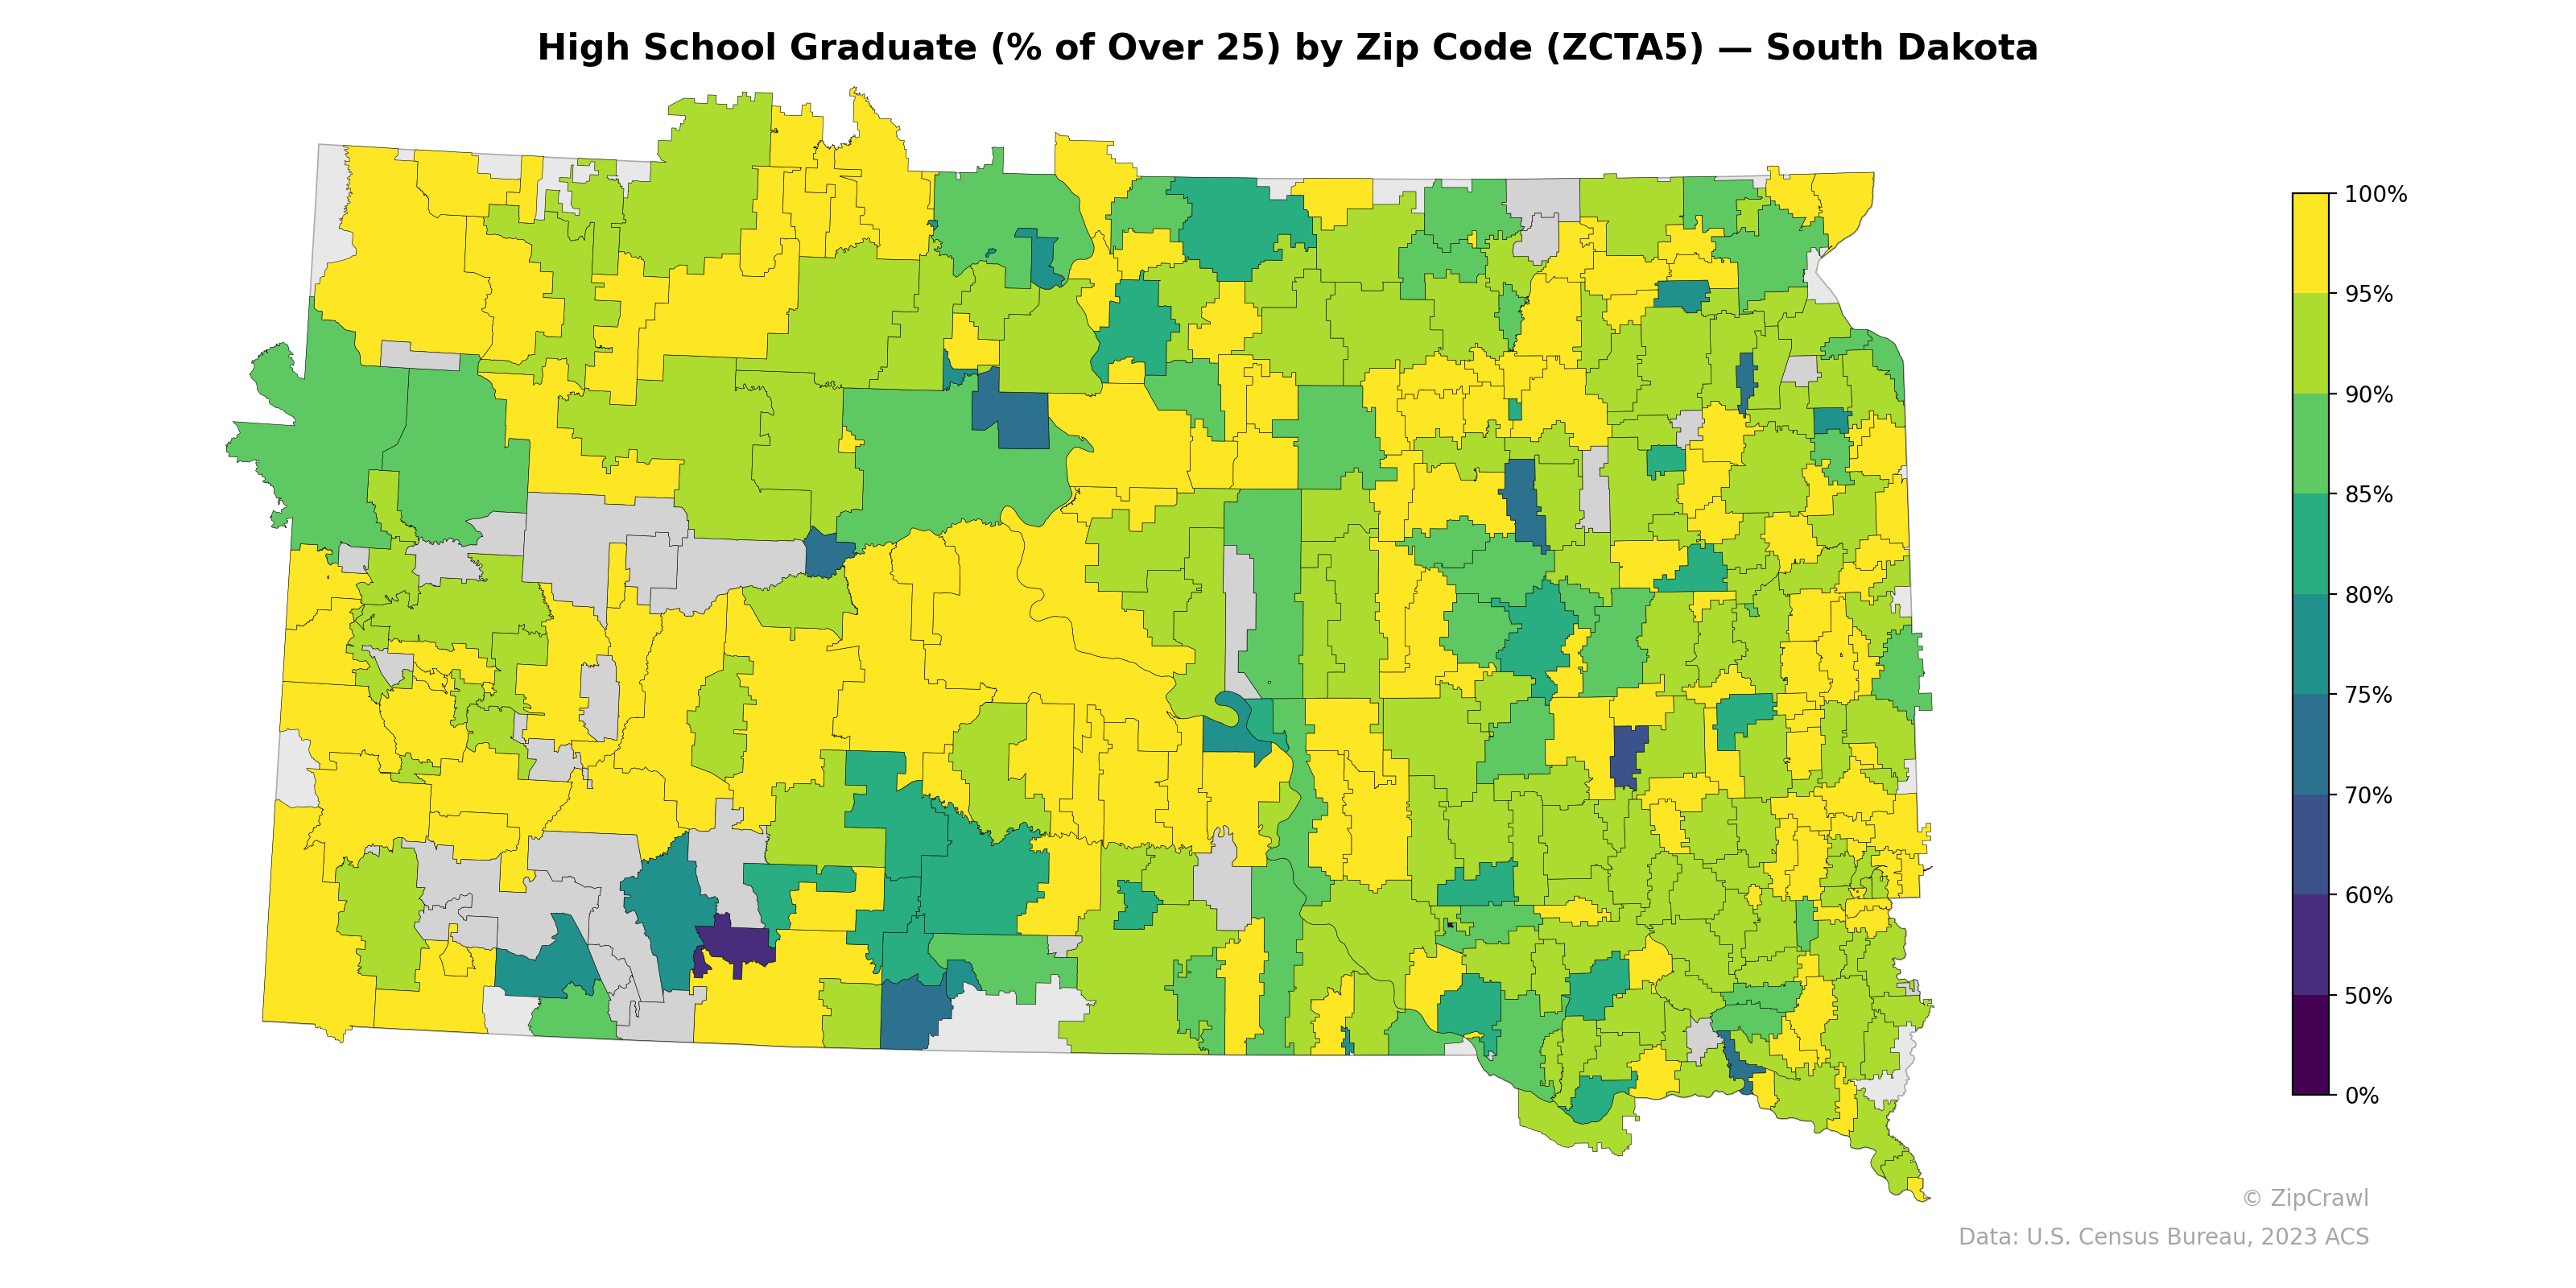
NOTE: Gray indicates insufficient data or a suppressed estimate.
Most of South Dakota's zip codes exhibit high school graduation rates above 85%, with the highest concentrations of near-100% rates appearing in the yellow-shaded agricultural regions of central and north-central South Dakota. A stark contrast emerges in the southwestern portion of the state and the southeastern corner, where several zip codes—likely corresponding to Native American reservations including Pine Ridge and Rosebud—drop to graduation rates between 40% and 70%, represented by deep teal and purple hues. Scattered pockets of moderately lower attainment (75–85%) also appear around urban centers such as Sioux Falls and Rapid City, potentially reflecting more diverse demographic compositions in those metro areas.
Data: U.S. Census Bureau, 2023 ACS
Explore
- Housing Owner-Occupied Median Value ($), by Zip Code (ZCTA5) — New York
- Housing % of Units Built Since 2010, by Zip Code (ZCTA5) — South Dakota
- Housing Median Monthly Rent ($), by Zip Code (ZCTA5) — South Dakota
- % of Households with Broadband Internet, by Zip Code (ZCTA5) — South Dakota
- Household Average Size by Zip Code (ZCTA5) — South Dakota
- Population Non-Hispanic American Indian % by Zip Code (ZCTA5) — South Dakota
- Housing Owner-Occupied Median Value ($), by Zip Code (ZCTA5) — South Dakota
- Housing Owner-Occupied % of Units, by Zip Code (ZCTA5) — South Dakota
- % of Population without Health Insurance, by Zip Code (ZCTA5) — South Dakota
- Bachelor's Degree or Higher (% of Over 25) by Zip Code (ZCTA5) — South Dakota
- Household Average Size by County
- Married Couple (% of all Households) by Zip Code (ZCTA5) — New York
- % of Population on Food Stamps or SNAP (Last 12 Months), by Zip Code (ZCTA5) — Massachusetts
- Housing % of Units Built Since 2010, by Zip Code (ZCTA5) — New York
- Household Average Size by Zip Code (ZCTA5) — New York
- Housing Owner-Occupied % of Units, by Zip Code (ZCTA5) — New York
- Bachelor's Degree or Higher (% of Over 25) by Zip Code (ZCTA5) — New York
- % of Households with Broadband Internet, by Zip Code (ZCTA5) — New York
- Housing Vacancy Rate by Zip Code (ZCTA5) — New York
- % of Population on Food Stamps or SNAP (Last 12 Months), by Zip Code (ZCTA5) — Florida
- Housing Median Monthly Rent ($), by Zip Code (ZCTA5) — New York
- % of Population without Health Insurance, by Zip Code (ZCTA5) — New York
- Population Non-Hispanic American Indian % by Zip Code (ZCTA5) — Rhode Island
- Housing Vacancy Rate by Zip Code (ZCTA5) — Alaska
- Married Couple (% of all Households) by Zip Code (ZCTA5) — Rhode Island
- Bachelor's Degree or Higher (% of Over 25) by Zip Code (ZCTA5) — Rhode Island
- U.S. Citizens (% of Population Over 18) by Zip Code (ZCTA5) — Oregon
- Population Non-Hispanic Black % by Zip Code (ZCTA5) — North Dakota
- Population Non-Hispanic American Indian % by Zip Code (ZCTA5) — North Dakota
- Household Average Size by Zip Code (ZCTA5) — Rhode Island
- High School Graduate (% of Over 25) by Zip Code (ZCTA5) — North Dakota
- High School Graduate (% of Over 25) by Zip Code (ZCTA5) — South Carolina
- High School Graduate (% of Over 25) by Zip Code (ZCTA5) — Ohio
- High School Graduate (% of Over 25) by Zip Code (ZCTA5) — Utah
- High School Graduate (% of Over 25) by Zip Code (ZCTA5) — Iowa
- High School Graduate (% of Over 25) by Zip Code (ZCTA5) — Minnesota
- High School Graduate (% of Over 25) by Zip Code (ZCTA5) — Colorado
- High School Graduate (% of Over 25) by Zip Code (ZCTA5) — Texas
- High School Graduate (% of Over 25) by Zip Code (ZCTA5) — Oregon
- High School Graduate (% of Over 25) by Zip Code (ZCTA5) — Idaho