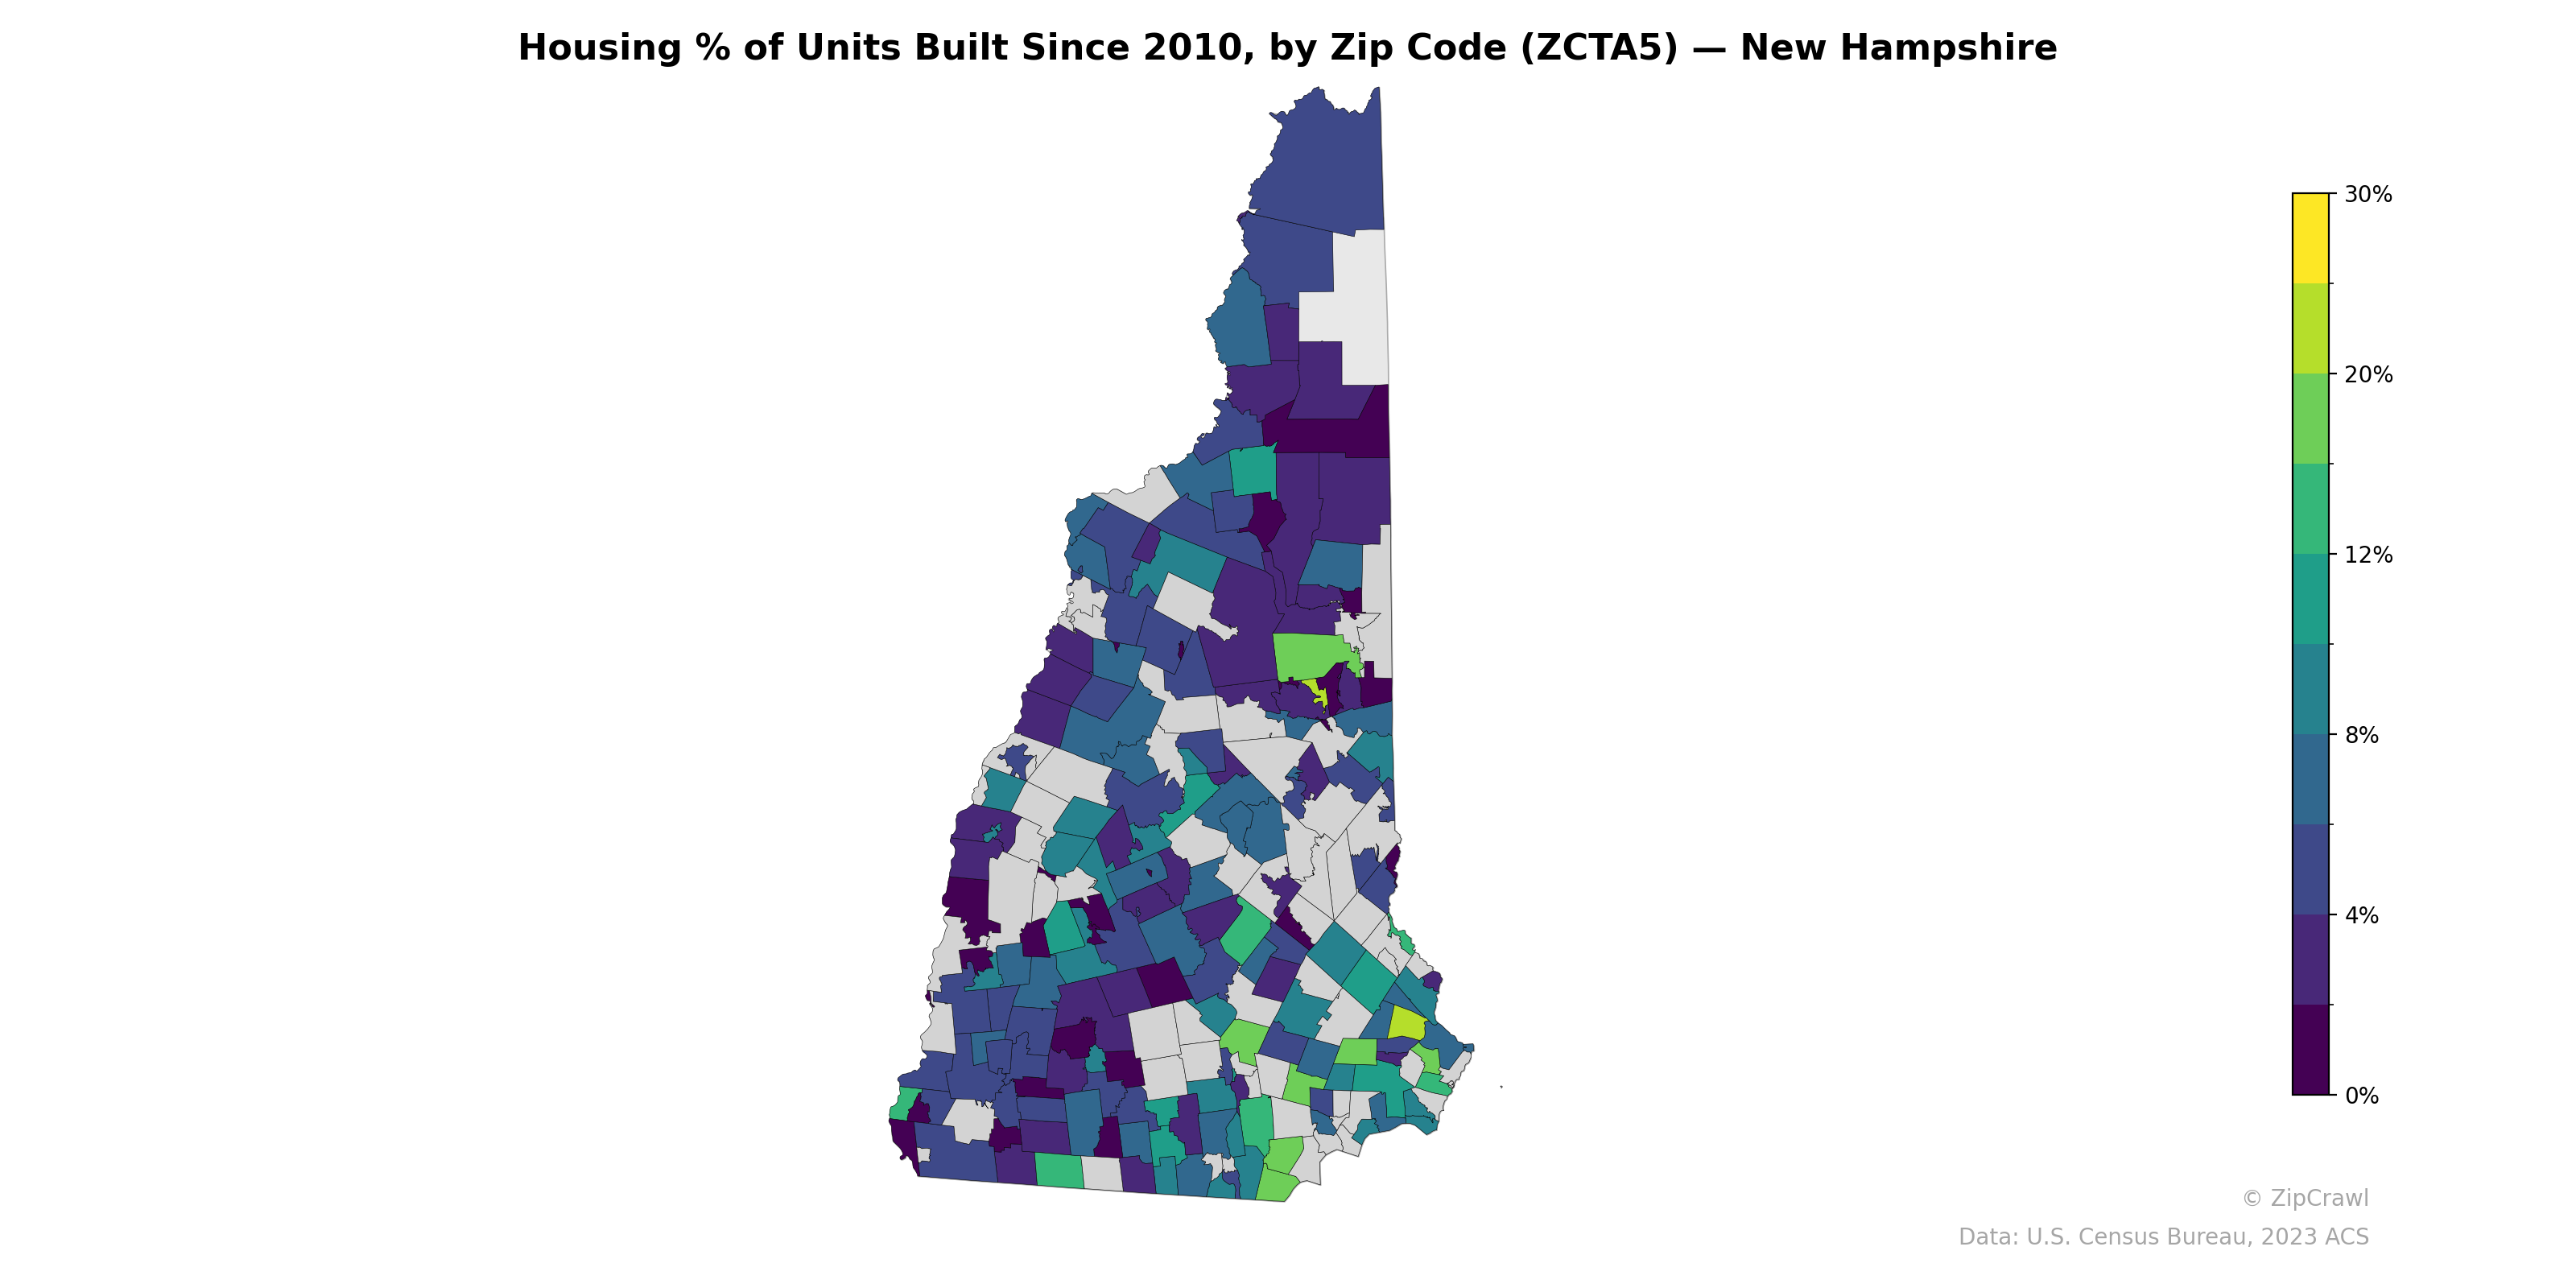
NOTE: Gray indicates insufficient data or a suppressed estimate.
Newer housing construction concentrates most visibly in the southeastern corner of the state near the seacoast and southern border regions, where several zip codes reach 12–20%+ of units built since 2010, likely driven by proximity to the Boston metro labor market. The northern third of the state displays a wide range, with some zip codes in Coös County showing moderate construction activity (8–12%) alongside pockets of near-zero growth, suggesting uneven development patterns in rural and resort areas. Central New Hampshire, particularly through the Lakes Region and upper Merrimack Valley, trends toward lower construction shares (0–4%), indicating a largely established housing stock with limited new development pressure.
Data: U.S. Census Bureau, 2023 ACS
Explore
- Population Non-Hispanic American Indian % by Zip Code (ZCTA5) — New York
- Median Age by Zip Code (ZCTA5) — New York
- Housing Owner-Occupied Median Value ($), by Zip Code (ZCTA5) — New Hampshire
- Population Non-Hispanic American Indian % by Zip Code (ZCTA5) — New Hampshire
- Household Average Size by Zip Code (ZCTA5) — New Hampshire
- Housing Median Monthly Rent ($), by Zip Code (ZCTA5) — New Hampshire
- % of Households with Broadband Internet, by Zip Code (ZCTA5) — New Hampshire
- Bachelor's Degree or Higher (% of Over 25) by Zip Code (ZCTA5) — New Hampshire
- Housing Owner-Occupied % of Units, by Zip Code (ZCTA5) — New Hampshire
- High School Graduate (% of Over 25) by Zip Code (ZCTA5) — New Hampshire
- % of Population without Health Insurance, by Zip Code (ZCTA5) — New Hampshire
- U.S. Citizens by County (% of Population Over 18)
- Population Non-Hispanic American Indian % by Zip Code (ZCTA5) — Virginia
- High School Graduate (% of Over 25) by Zip Code (ZCTA5) — New York
- Population Non-Hispanic White % by Zip Code (ZCTA5) — New York
- Household Median Income by Zip Code (ZCTA5) — New York
- Population Non-Hispanic Black % by Zip Code (ZCTA5) — New York
- Population Hispanic % by Zip Code (ZCTA5) — New York
- Population Non-Hispanic Asian % by Zip Code (ZCTA5) — Florida
- U.S. Citizens (% of Population Over 18) by Zip Code (ZCTA5) — New York
- % of Population on Food Stamps or SNAP (Last 12 Months), by Zip Code (ZCTA5) — Florida
- % of Population without Health Insurance, by Zip Code (ZCTA5) — West Virginia
- Bachelor's Degree or Higher (% of Over 25) by Zip Code (ZCTA5) — West Virginia
- % of Population on Food Stamps or SNAP (Last 12 Months), by Zip Code (ZCTA5) — West Virginia
- Housing Owner-Occupied % of Units, by Zip Code (ZCTA5) — West Virginia
- Housing Vacancy Rate by Zip Code (ZCTA5) — West Virginia
- Population Hispanic % by Zip Code (ZCTA5) — Hawaii
- High School Graduate (% of Over 25) by Zip Code (ZCTA5) — West Virginia
- % of Households with Broadband Internet, by Zip Code (ZCTA5) — West Virginia
- Population Non-Hispanic American Indian % by Zip Code (ZCTA5) — West Virginia
- Housing % of Units Built Since 2010, by Zip Code (ZCTA5) — New York
- Housing % of Units Built Since 2010, by Zip Code (ZCTA5) — New Jersey
- Housing % of Units Built Since 2010, by Zip Code (ZCTA5) — New Mexico
- Housing % of Units Built Since 2010, by Zip Code (ZCTA5) — Nevada
- Housing % of Units Built Since 2010, by Zip Code (ZCTA5) — Hawaii
- Housing % of Units Built Since 2010, by Zip Code (ZCTA5) — Ohio
- Housing % of Units Built Since 2010, by Zip Code (ZCTA5) — Utah
- Housing % of Units Built Since 2010, by Zip Code (ZCTA5) — Nebraska
- Housing % of Units Built Since 2010, by Zip Code (ZCTA5) — Iowa
- Housing % of Units Built Since 2010, by Zip Code (ZCTA5) — New York Metro