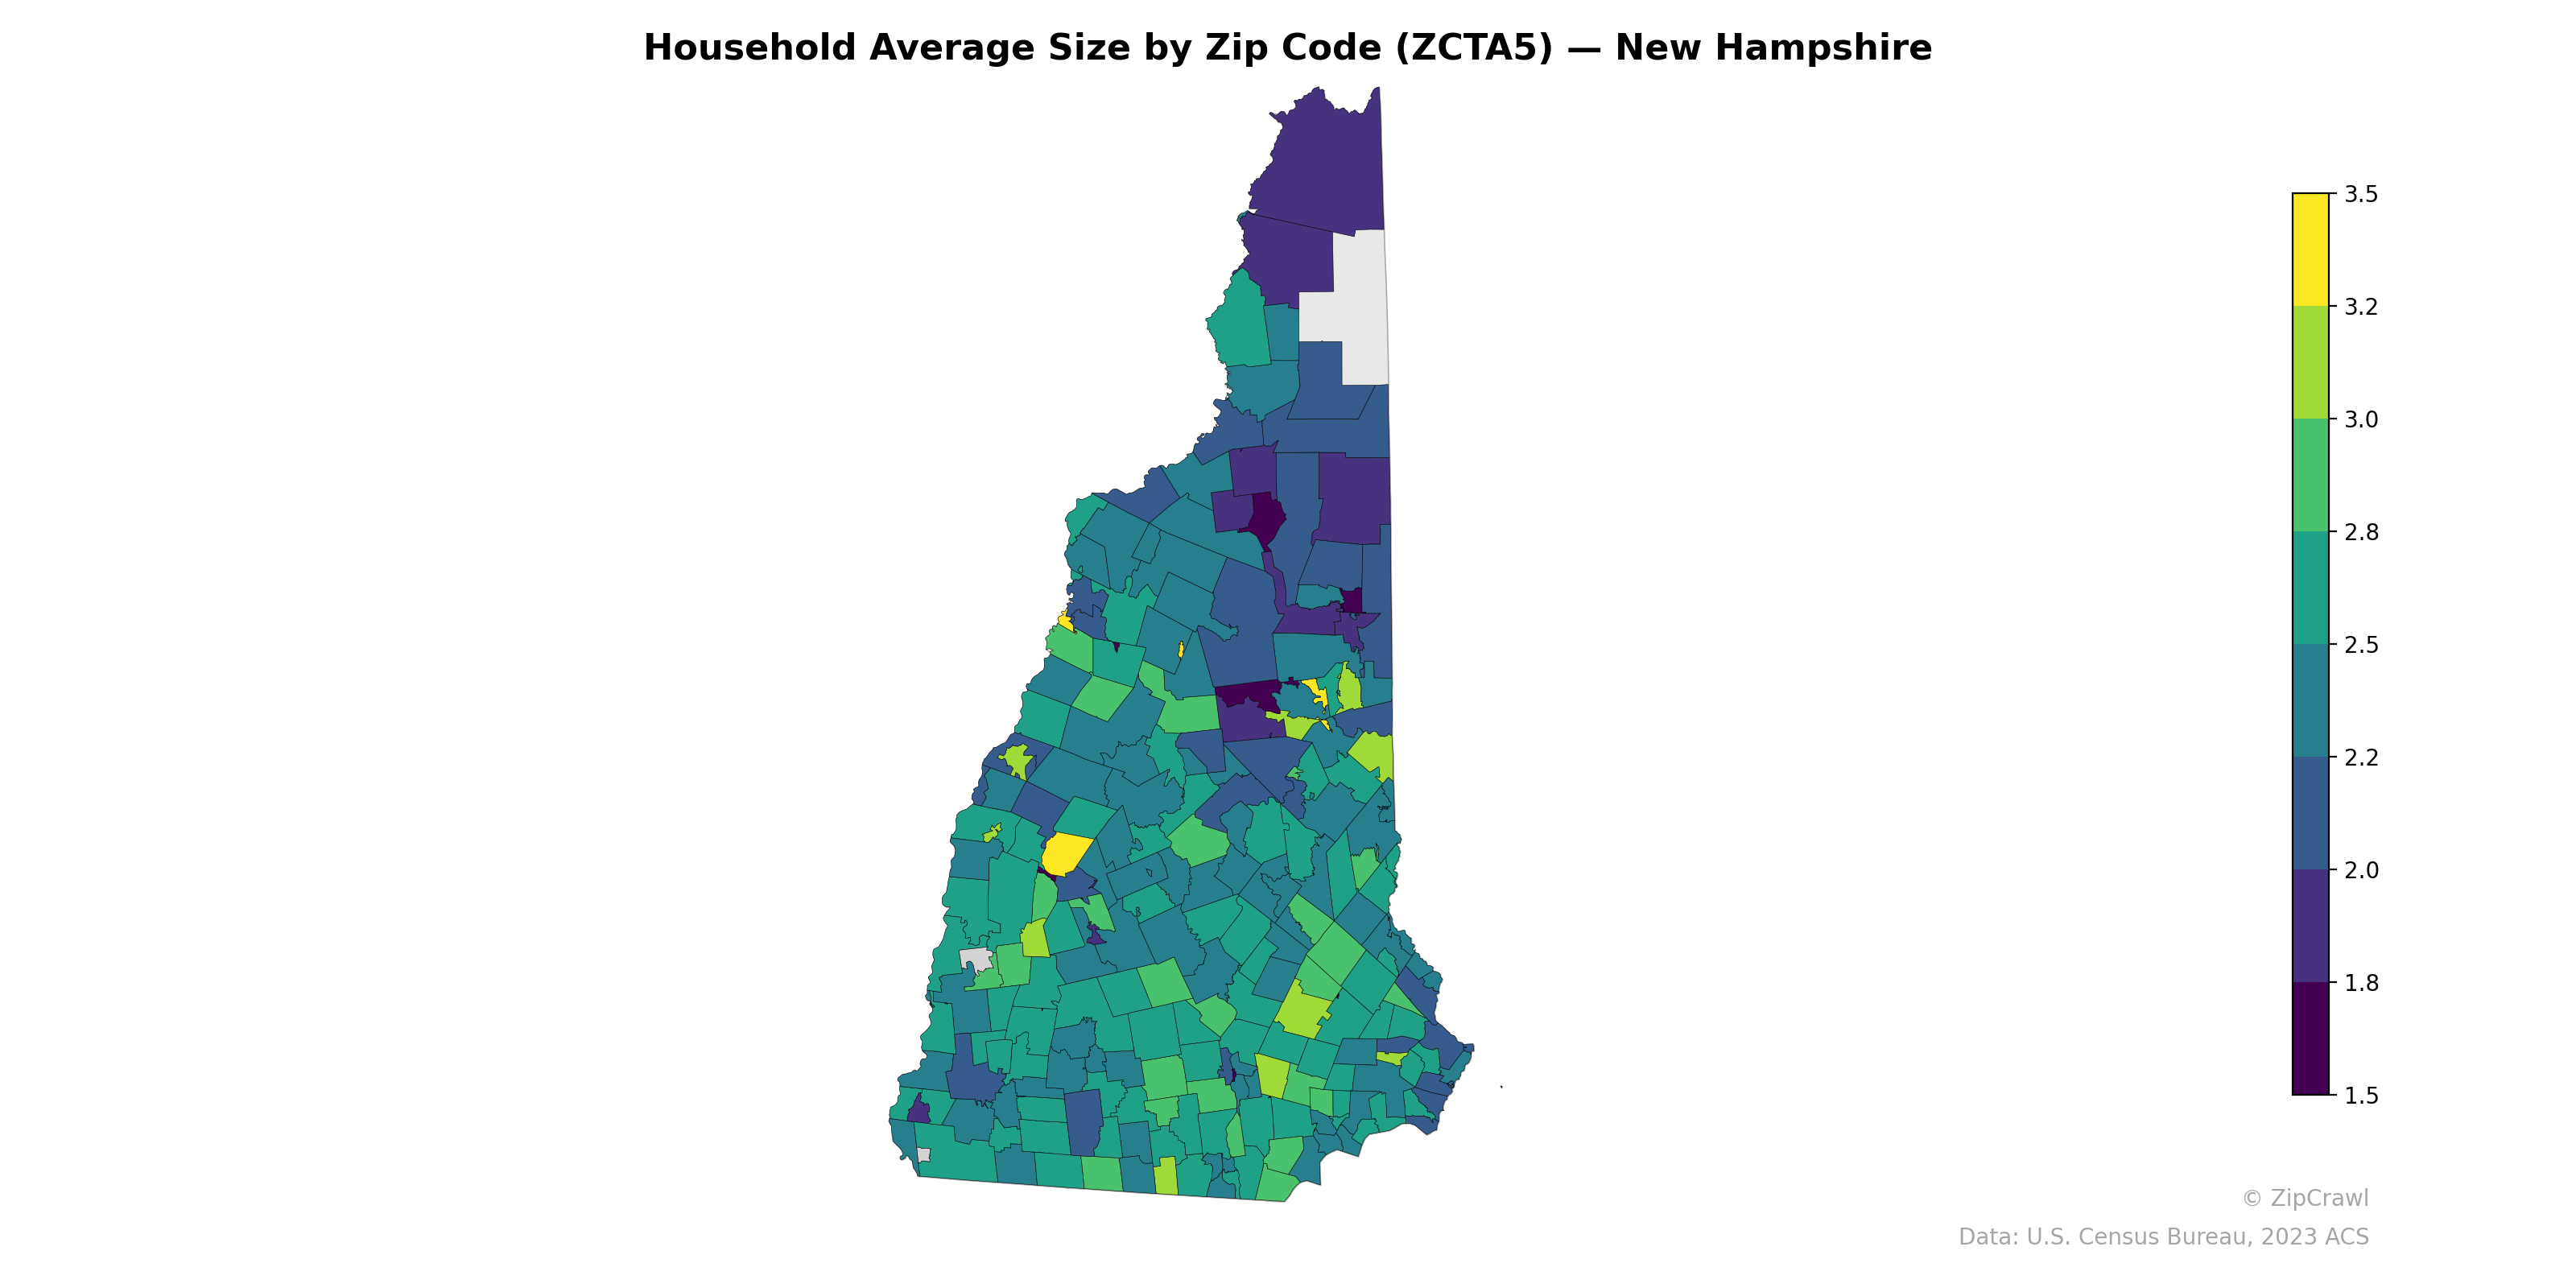
NOTE: Gray indicates insufficient data or a suppressed estimate.
Suburban zip codes in southern New Hampshire—particularly in the Rockingham and Hillsborough County corridors near the Massachusetts border—exhibit the largest average household sizes, with several areas reaching 3.0 to 3.5 persons, consistent with family-oriented commuter communities. The northern regions, especially in Coös County, trend notably lower at 1.5 to 2.2 persons per household, reflecting aging populations and smaller rural households. Urban cores such as Manchester, Concord, and smaller college towns like Hanover and Durham also register lower averages, likely driven by higher concentrations of single-person households, renters, and student populations.
Data: U.S. Census Bureau, 2023 ACS
Explore
- High School Graduate (% of Over 25) by Zip Code (ZCTA5) — New York
- Median Age by Zip Code (ZCTA5) — New York
- % of Population without Health Insurance, by Zip Code (ZCTA5) — New Hampshire
- Bachelor's Degree or Higher (% of Over 25) by Zip Code (ZCTA5) — New Hampshire
- Housing Median Monthly Rent ($), by Zip Code (ZCTA5) — New Hampshire
- Housing Owner-Occupied Median Value ($), by Zip Code (ZCTA5) — New Hampshire
- % of Households with Broadband Internet, by Zip Code (ZCTA5) — New Hampshire
- Housing Owner-Occupied % of Units, by Zip Code (ZCTA5) — New Hampshire
- Population Non-Hispanic American Indian % by Zip Code (ZCTA5) — New Hampshire
- High School Graduate (% of Over 25) by Zip Code (ZCTA5) — New Hampshire
- Housing % of Units Built Since 2010, by Zip Code (ZCTA5) — New Hampshire
- U.S. Citizens by County (% of Population Over 18)
- High School Graduate (% of Over 25) by Zip Code (ZCTA5) — Virginia
- Population Non-Hispanic American Indian % by Zip Code (ZCTA5) — New York
- Household Median Income by Zip Code (ZCTA5) — New York
- Population Non-Hispanic White % by Zip Code (ZCTA5) — New York
- U.S. Citizens (% of Population Over 18) by Zip Code (ZCTA5) — New York
- Population Hispanic % by Zip Code (ZCTA5) — New York
- Population Non-Hispanic Asian % by Zip Code (ZCTA5) — Florida
- % of Population on Food Stamps or SNAP (Last 12 Months), by Zip Code (ZCTA5) — Florida
- Population Non-Hispanic Black % by Zip Code (ZCTA5) — New York
- % of Population without Health Insurance, by Zip Code (ZCTA5) — West Virginia
- Bachelor's Degree or Higher (% of Over 25) by Zip Code (ZCTA5) — West Virginia
- % of Population on Food Stamps or SNAP (Last 12 Months), by Zip Code (ZCTA5) — West Virginia
- Housing Vacancy Rate by Zip Code (ZCTA5) — West Virginia
- Population Non-Hispanic American Indian % by Zip Code (ZCTA5) — West Virginia
- Housing Owner-Occupied % of Units, by Zip Code (ZCTA5) — West Virginia
- High School Graduate (% of Over 25) by Zip Code (ZCTA5) — West Virginia
- % of Households with Broadband Internet, by Zip Code (ZCTA5) — West Virginia
- Population Non-Hispanic Asian % by Zip Code (ZCTA5) — West Virginia
- Household Average Size by Zip Code (ZCTA5) — New York
- Household Average Size by Zip Code (ZCTA5) — New Jersey
- Household Average Size by Zip Code (ZCTA5) — New Mexico
- Household Average Size by Zip Code (ZCTA5) — Nevada
- Household Average Size by Zip Code (ZCTA5) — Hawaii
- Household Average Size by Zip Code (ZCTA5) — Nebraska
- Household Average Size by Zip Code (ZCTA5) — Ohio
- Household Average Size by Zip Code (ZCTA5) — Utah
- Household Average Size by Zip Code (ZCTA5) — Iowa
- Household Average Size by Zip Code (ZCTA5) — New York Metro