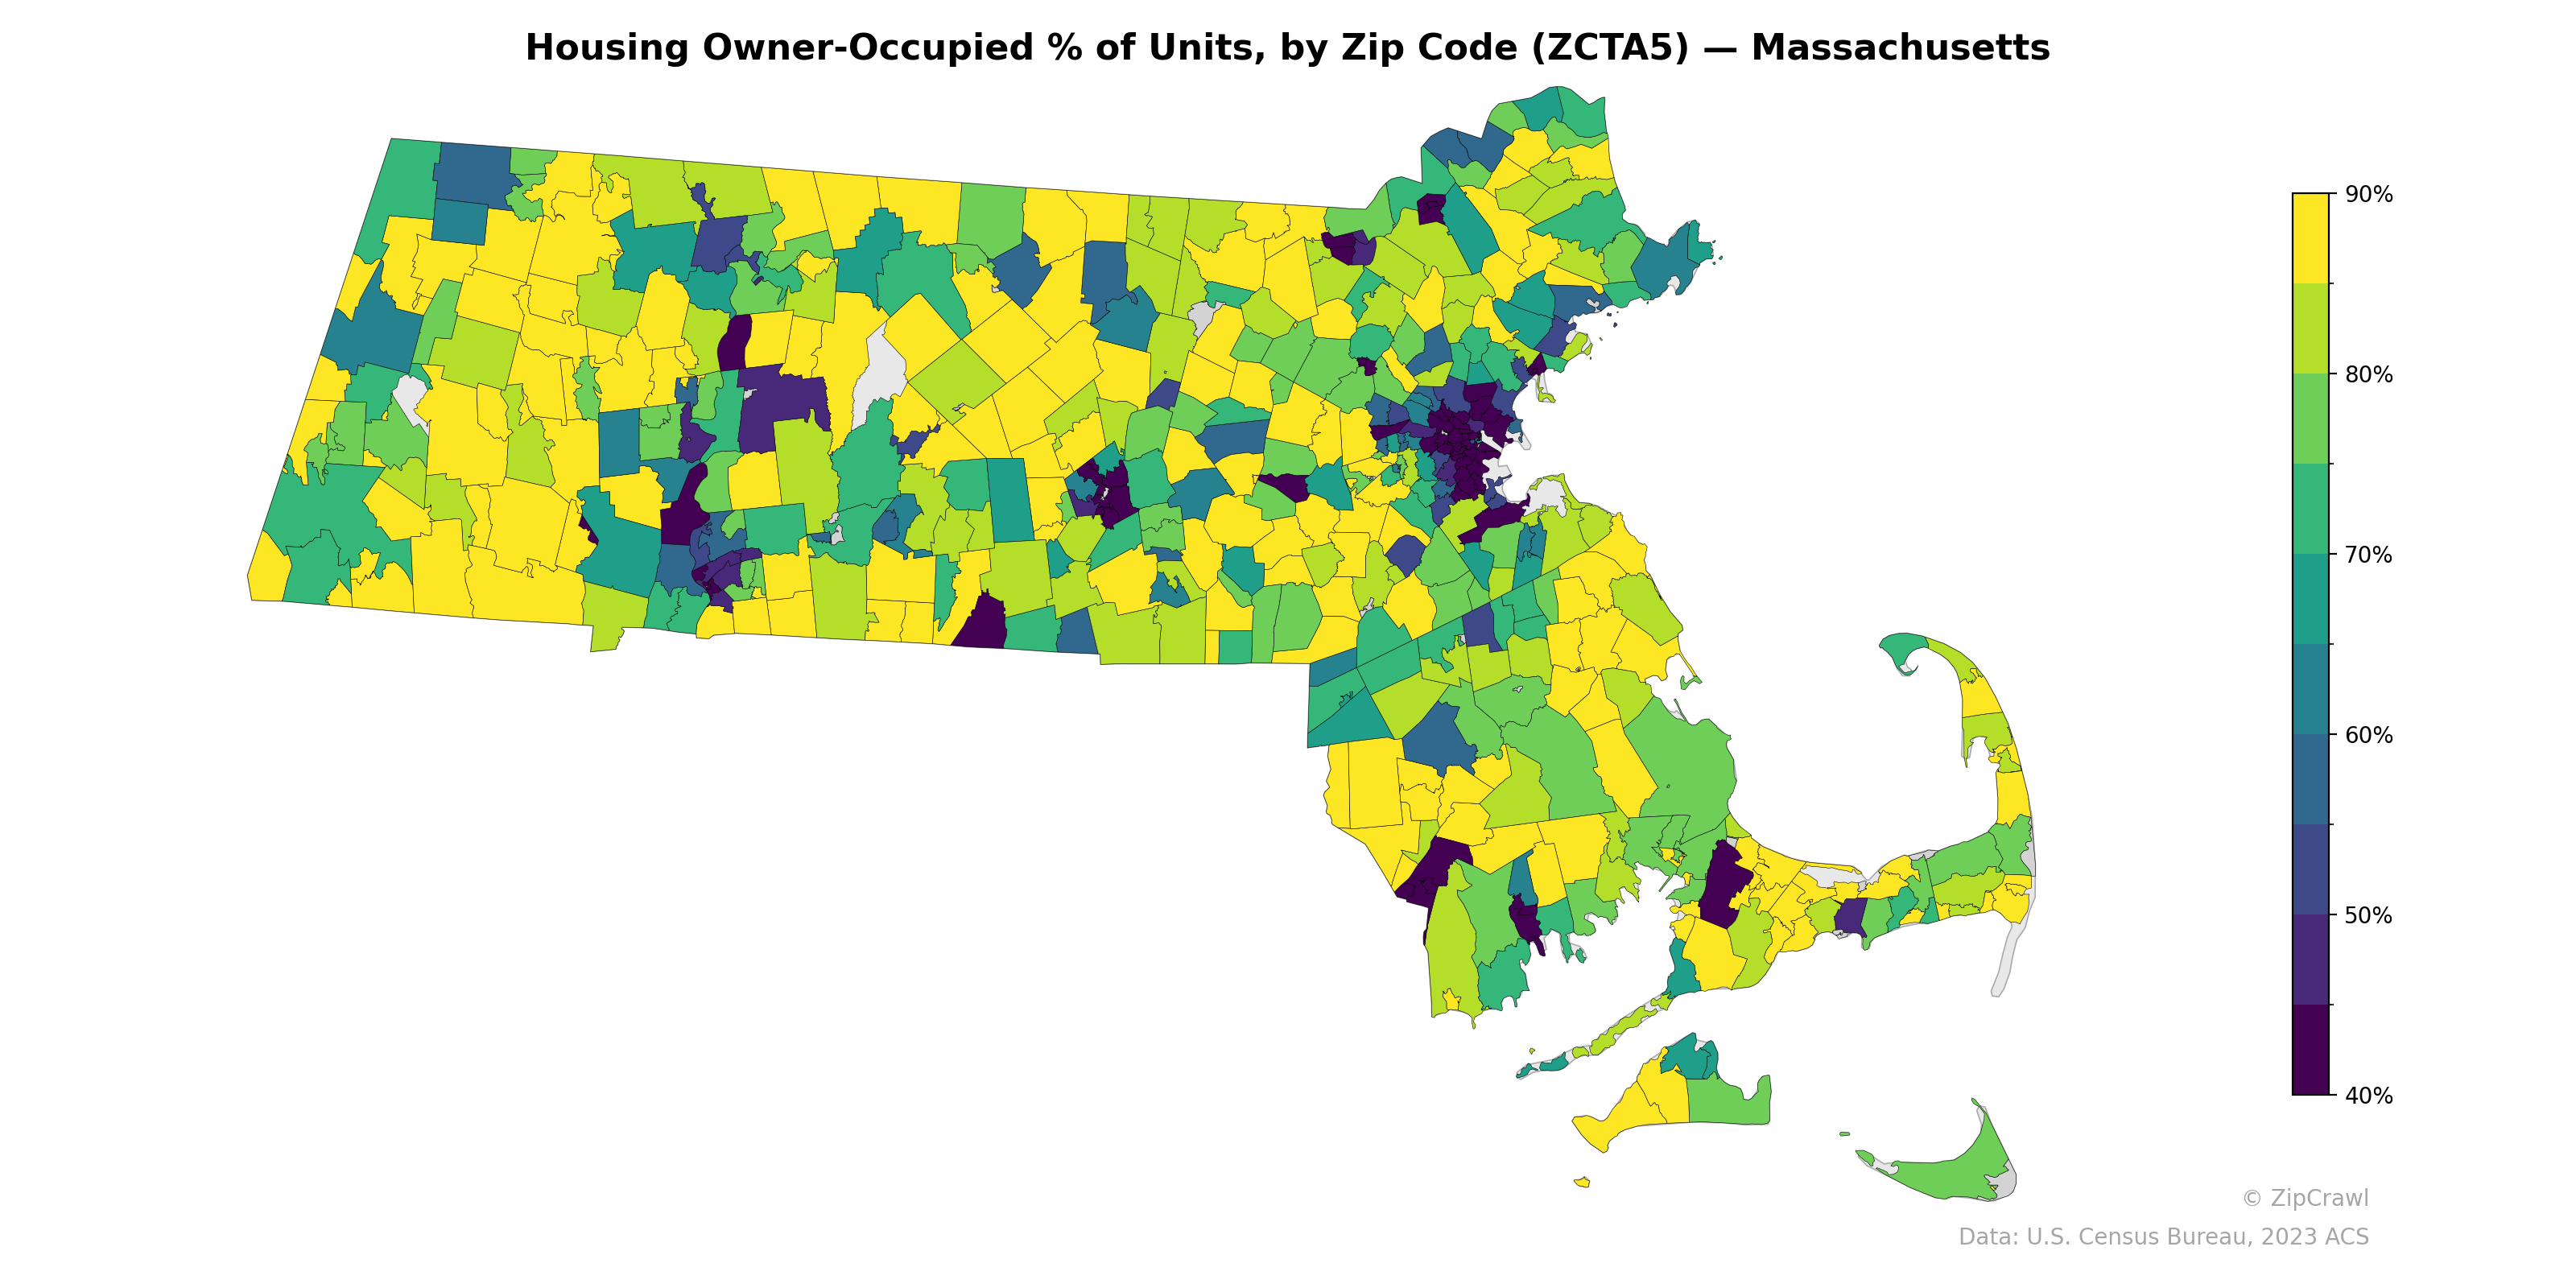
NOTE: Gray indicates insufficient data or a suppressed estimate.
Owner-occupancy rates are consistently highest—often exceeding 85–90%—across the suburban and exurban zip codes of central and western Massachusetts, as well as in outer-ring communities south and west of Boston. The Boston metro core, including zip codes in and around the city proper, Cambridge, and Somerville, displays the lowest owner-occupancy rates, frequently falling below 40–50%, with similarly low clusters visible in Springfield, Holyoke, New Bedford, and Fall River. Cape Cod and the Islands present a mixed pattern, with moderate owner-occupancy in many areas but notably lower rates in Provincetown and parts of Nantucket, likely reflecting high concentrations of seasonal rental housing.
Data: U.S. Census Bureau, 2023 ACS
Explore
- Household Average Size by Zip Code (ZCTA5) — Massachusetts
- Housing % of Units Built Since 2010, by Zip Code (ZCTA5) — Massachusetts
- Housing Vacancy Rate by Zip Code (ZCTA5) — Massachusetts
- Married Couple (% of all Households) by Zip Code (ZCTA5) — Massachusetts
- Bachelor's Degree or Higher (% of Over 25) by Zip Code (ZCTA5) — Massachusetts
- Housing Median Monthly Rent ($), by Zip Code (ZCTA5) — Massachusetts
- % of Population without Health Insurance, by Zip Code (ZCTA5) — Massachusetts
- % of Households with Broadband Internet, by Zip Code (ZCTA5) — Massachusetts
- Housing Owner-Occupied Median Value ($), by Zip Code (ZCTA5) — Massachusetts
- % of Population on Food Stamps or SNAP (Last 12 Months), by Zip Code (ZCTA5) — Delaware
- Population Non-Hispanic Black % by County
- Housing Vacancy Rate by Zip Code (ZCTA5) — Los Angeles Metro
- Household Average Size by Zip Code (ZCTA5) — Los Angeles Metro
- Married Couple (% of all Households) by Zip Code (ZCTA5) — Los Angeles Metro
- % of Population without Health Insurance, by Zip Code (ZCTA5) — Los Angeles Metro
- Housing Median Monthly Rent ($), by Zip Code (ZCTA5) — Los Angeles Metro
- Bachelor's Degree or Higher (% of Over 25) by Zip Code (ZCTA5) — Los Angeles Metro
- Housing Owner-Occupied Median Value ($), by Zip Code (ZCTA5) — Los Angeles Metro
- Housing Owner-Occupied Median Value ($), by Zip Code (ZCTA5) — New York Metro
- % of Households with Broadband Internet, by Zip Code (ZCTA5) — Los Angeles Metro
- Housing % of Units Built Since 2010, by Zip Code (ZCTA5) — Los Angeles Metro
- Housing % of Units Built Since 2010, by Zip Code (ZCTA5) — Tennessee
- Housing Owner-Occupied Median Value ($), by Zip Code (ZCTA5) — Tennessee
- Household Average Size by Zip Code (ZCTA5) — Tennessee
- Population Non-Hispanic American Indian % by Zip Code (ZCTA5) — Tennessee
- Population Non-Hispanic Black % by Zip Code (ZCTA5) — Tennessee
- % of Households with Broadband Internet, by Zip Code (ZCTA5) — Tennessee
- % of Population without Health Insurance, by Zip Code (ZCTA5) — Tennessee
- Housing Median Monthly Rent ($), by Zip Code (ZCTA5) — Tennessee
- High School Graduate (% of Over 25) by Zip Code (ZCTA5) — Tennessee
- Housing Owner-Occupied % of Units, by Zip Code (ZCTA5) — Maine
- Housing Owner-Occupied % of Units, by Zip Code (ZCTA5) — Utah
- Housing Owner-Occupied % of Units, by Zip Code (ZCTA5) — Ohio
- Housing Owner-Occupied % of Units, by Zip Code (ZCTA5) — Maryland
- Housing Owner-Occupied % of Units, by Zip Code (ZCTA5) — Iowa
- Housing Owner-Occupied % of Units, by Zip Code (ZCTA5) — Montana
- Housing Owner-Occupied % of Units, by Zip Code (ZCTA5) — Oregon
- Housing Owner-Occupied % of Units, by Zip Code (ZCTA5) — Texas
- Housing Owner-Occupied % of Units, by Zip Code (ZCTA5) — Idaho
- Housing Owner-Occupied % of Units, by Zip Code (ZCTA5) — Hawaii