NOTE: Gray indicates insufficient data or a suppressed estimate.
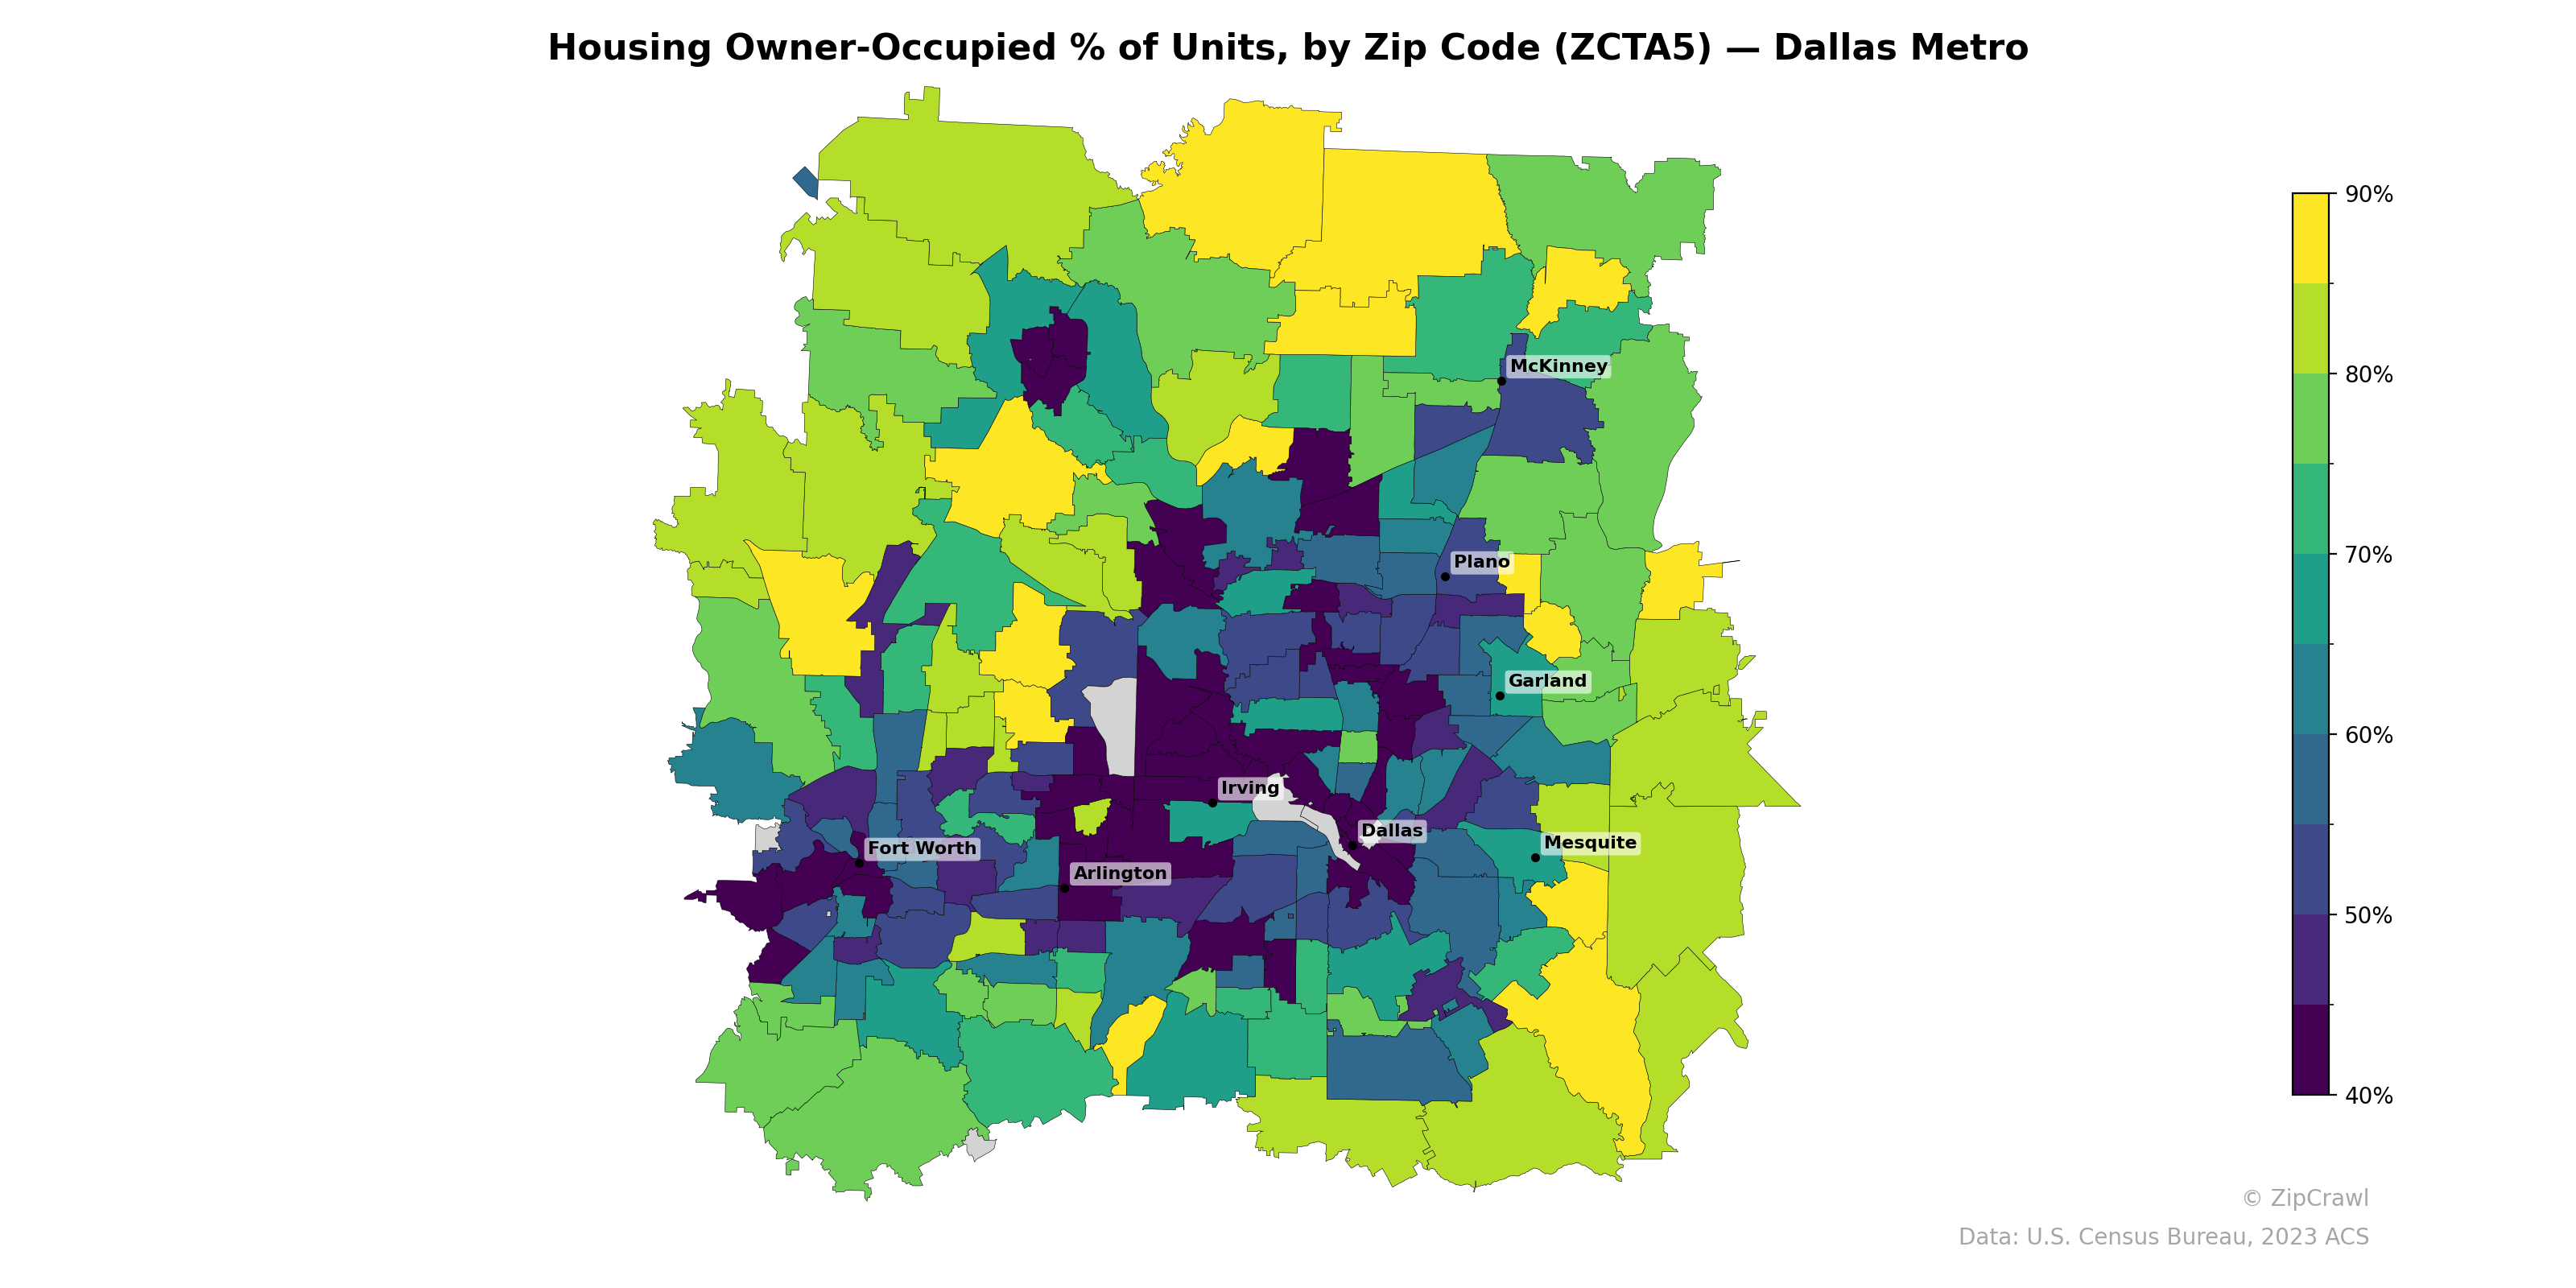
Owner-occupancy rates in the Dallas metro exhibit a pronounced core-periphery gradient, with the lowest concentrations (below 50%) clustered tightly around central Dallas, southern Irving, and parts of south Fort Worth, reflecting dense renter-heavy urban corridors. Outer suburban and exurban zip codes—particularly to the north toward McKinney, the far northeast, and the southern and western fringes—consistently exceed 80% owner-occupancy, with several reaching above 90%. Notable pockets of lower ownership also appear in select mid-ring areas near Garland and scattered zones west of Fort Worth, suggesting localized apartment or multifamily housing concentrations beyond the urban core.
Data: U.S. Census Bureau, 2023 ACS
Explore
- Population Hispanic % by Zip Code (ZCTA5) — New York Metro
- Housing Vacancy Rate by Zip Code (ZCTA5) — Dallas Metro
- Housing Owner-Occupied Median Value ($), by Zip Code (ZCTA5) — Dallas Metro
- Housing Median Monthly Rent ($), by Zip Code (ZCTA5) — Dallas Metro
- Married Couple (% of all Households) by Zip Code (ZCTA5) — Dallas Metro
- Household Average Size by Zip Code (ZCTA5) — Dallas Metro
- Housing % of Units Built Since 2010, by Zip Code (ZCTA5) — Dallas Metro
- Bachelor's Degree or Higher (% of Over 25) by Zip Code (ZCTA5) — Dallas Metro
- % of Households with Broadband Internet, by Zip Code (ZCTA5) — Dallas Metro
- % of Population without Health Insurance, by Zip Code (ZCTA5) — Dallas Metro
- % of Population on Food Stamps or SNAP (Last 12 Months), by Zip Code (ZCTA5) — Iowa
- Median Age by County
- U.S. Citizens (% of Population Over 18) by Zip Code (ZCTA5) — New York Metro
- Population Non-Hispanic White % by Zip Code (ZCTA5) — New York Metro
- High School Graduate (% of Over 25) by Zip Code (ZCTA5) — New York Metro
- % of Population on Food Stamps or SNAP (Last 12 Months), by County
- Median Age by Zip Code (ZCTA5) — New York Metro
- Population Non-Hispanic Black % by Zip Code (ZCTA5) — New York Metro
- Bachelor's Degree or Higher (% of Over 25) by Zip Code (ZCTA5) — New York Metro
- Household Median Income by Zip Code (ZCTA5) — New York Metro
- Population Non-Hispanic American Indian % by Zip Code (ZCTA5) — New York Metro
- % of Population without Health Insurance, by Zip Code (ZCTA5) — Ohio
- Bachelor's Degree or Higher (% of Over 25) by Zip Code (ZCTA5) — Ohio
- Housing Owner-Occupied Median Value ($), by Zip Code (ZCTA5) — Ohio
- Population Non-Hispanic White % by Zip Code (ZCTA5) — Ohio
- Median Age by Zip Code (ZCTA5) — Ohio
- Population Non-Hispanic American Indian % by Zip Code (ZCTA5) — Ohio
- High School Graduate (% of Over 25) by Zip Code (ZCTA5) — Ohio
- % of Households with Broadband Internet, by Zip Code (ZCTA5) — Ohio
- Population Hispanic % by Zip Code (ZCTA5) — Ohio
- Housing Owner-Occupied % of Units, by Zip Code (ZCTA5) — Detroit Metro
- Housing Owner-Occupied % of Units, by Zip Code (ZCTA5) — Denver Metro
- Housing Owner-Occupied % of Units, by Zip Code (ZCTA5) — Houston Metro
- Housing Owner-Occupied % of Units, by Zip Code (ZCTA5) — Miami Metro
- Housing Owner-Occupied % of Units, by Zip Code (ZCTA5) — Boston Metro
- Housing Owner-Occupied % of Units, by Zip Code (ZCTA5) — Tampa Metro
- Housing Owner-Occupied % of Units, by Zip Code (ZCTA5) — Austin Metro
- Housing Owner-Occupied % of Units, by Zip Code (ZCTA5) — Chicago Metro
- Housing Owner-Occupied % of Units, by Zip Code (ZCTA5) — Orlando Metro
- Housing Owner-Occupied % of Units, by Zip Code (ZCTA5) — San Diego Metro