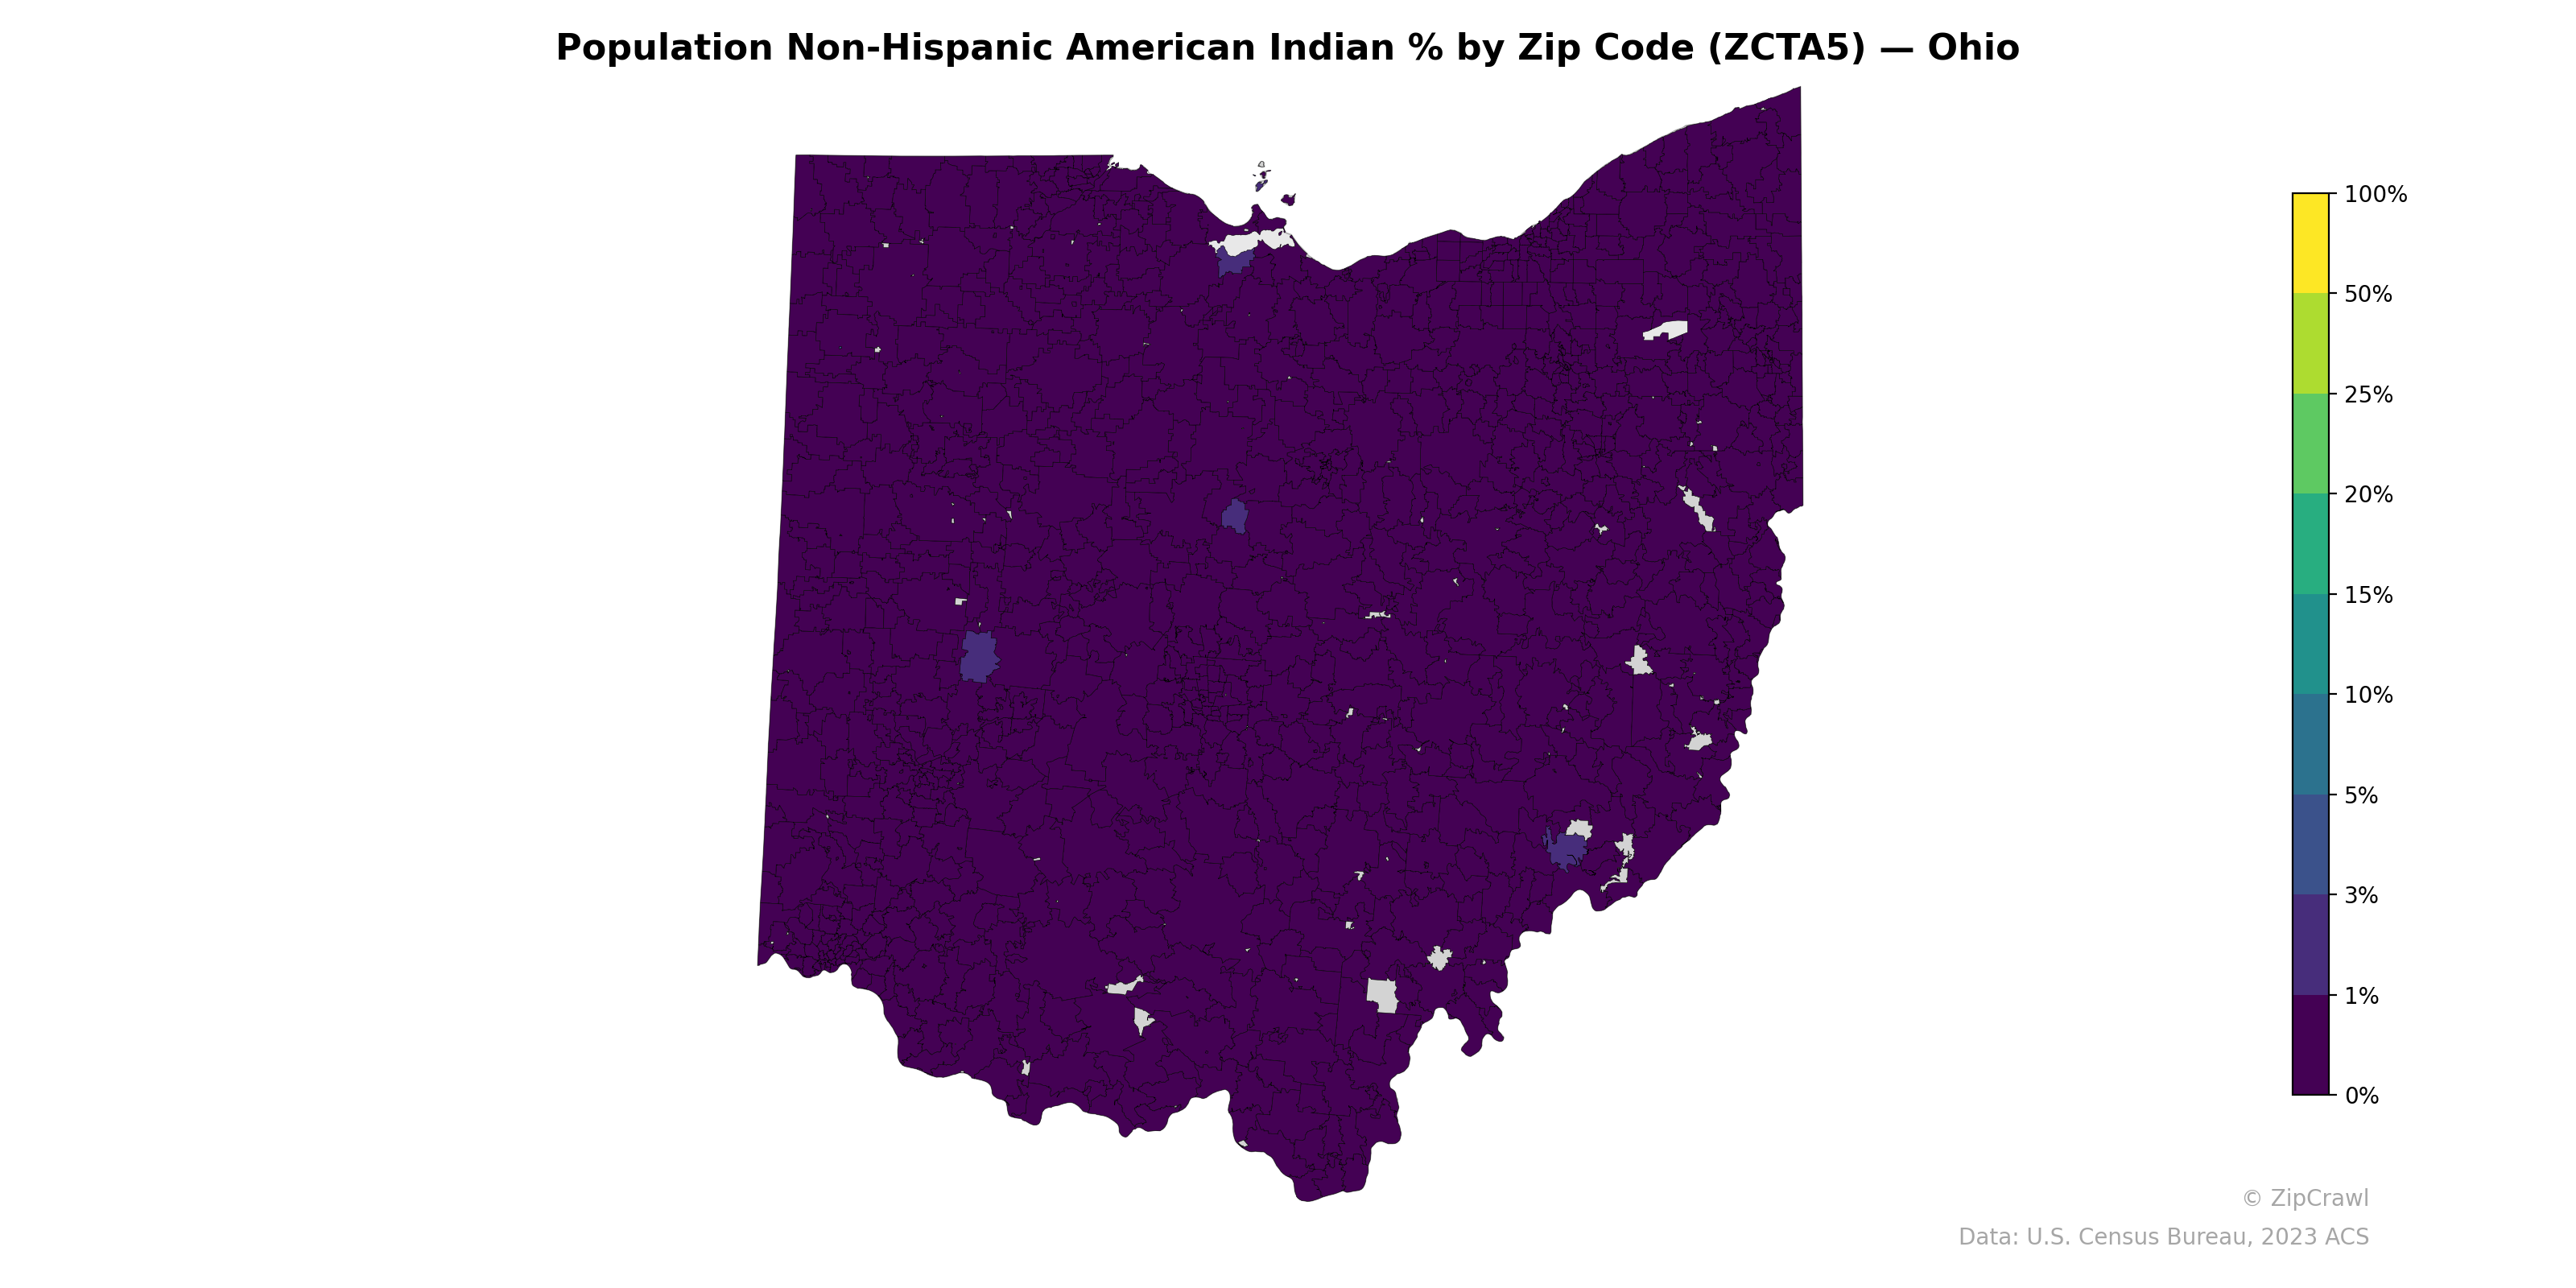
NOTE: Gray indicates insufficient data or a suppressed estimate.
The Non-Hispanic American Indian population across Ohio's zip codes is overwhelmingly below 1%, with the vast majority of the state shaded in deep purple, indicating minimal representation of this demographic group. A few isolated zip codes—notably in the central-western part of the state and scattered along the southern border—appear as lighter purple or white gaps, suggesting either slightly elevated percentages or areas with no reported population data. No meaningful geographic clustering or corridor of higher concentration is evident, reflecting the broadly dispersed and very small share of this population statewide.
Data: U.S. Census Bureau, 2023 ACS
Explore
- % of Population on Food Stamps or SNAP (Last 12 Months), by County
- Median Age by Zip Code (ZCTA5) — Ohio
- Population Non-Hispanic White % by Zip Code (ZCTA5) — Ohio
- Population Non-Hispanic Black % by Zip Code (ZCTA5) — Ohio
- % of Population on Food Stamps or SNAP (Last 12 Months), by Zip Code (ZCTA5) — Pennsylvania
- Population Non-Hispanic Asian % by Zip Code (ZCTA5) — Pennsylvania
- High School Graduate (% of Over 25) by Zip Code (ZCTA5) — Ohio
- U.S. Citizens (% of Population Over 18) by Zip Code (ZCTA5) — Ohio
- Population Hispanic % by Zip Code (ZCTA5) — Ohio
- Household Median Income by Zip Code (ZCTA5) — Ohio
- Housing % of Units Built Since 2010, by Zip Code (ZCTA5) — Connecticut
- Median Age by County
- U.S. Citizens (% of Population Over 18) by Zip Code (ZCTA5) — New York Metro
- Population Non-Hispanic White % by Zip Code (ZCTA5) — New York Metro
- Bachelor's Degree or Higher (% of Over 25) by Zip Code (ZCTA5) — New York Metro
- Population Non-Hispanic Black % by Zip Code (ZCTA5) — New York Metro
- High School Graduate (% of Over 25) by Zip Code (ZCTA5) — New York Metro
- Household Median Income by Zip Code (ZCTA5) — New York Metro
- Median Age by Zip Code (ZCTA5) — New York Metro
- Population Hispanic % by Zip Code (ZCTA5) — New York Metro
- Housing Owner-Occupied Median Value ($), by Zip Code (ZCTA5) — Ohio
- Housing Owner-Occupied % of Units, by Zip Code (ZCTA5) — Ohio
- Housing Median Monthly Rent ($), by Zip Code (ZCTA5) — Ohio
- Bachelor's Degree or Higher (% of Over 25) by Zip Code (ZCTA5) — Ohio
- Housing % of Units Built Since 2010, by Zip Code (ZCTA5) — Ohio
- Housing % of Units Built Since 2010, by Zip Code (ZCTA5) — Georgia
- % of Households with Broadband Internet, by Zip Code (ZCTA5) — Ohio
- % of Population without Health Insurance, by Zip Code (ZCTA5) — Ohio
- High School Graduate (% of Over 25) by Zip Code (ZCTA5) — Georgia
- Household Average Size by Zip Code (ZCTA5) — Ohio
- Population Non-Hispanic American Indian % by Zip Code (ZCTA5) — Indiana
- Population Non-Hispanic American Indian % by Zip Code (ZCTA5) — Oregon
- Population Non-Hispanic American Indian % by Zip Code (ZCTA5) — Iowa
- Population Non-Hispanic American Indian % by Zip Code (ZCTA5) — Utah
- Population Non-Hispanic American Indian % by Zip Code (ZCTA5) — Idaho
- Population Non-Hispanic American Indian % by Zip Code (ZCTA5) — Hawaii
- Population Non-Hispanic American Indian % by Zip Code (ZCTA5) — Nevada
- Population Non-Hispanic American Indian % by Zip Code (ZCTA5) — Texas
- Population Non-Hispanic American Indian % by Zip Code (ZCTA5) — Maine
- Population Non-Hispanic American Indian % by Zip Code (ZCTA5) — Alaska