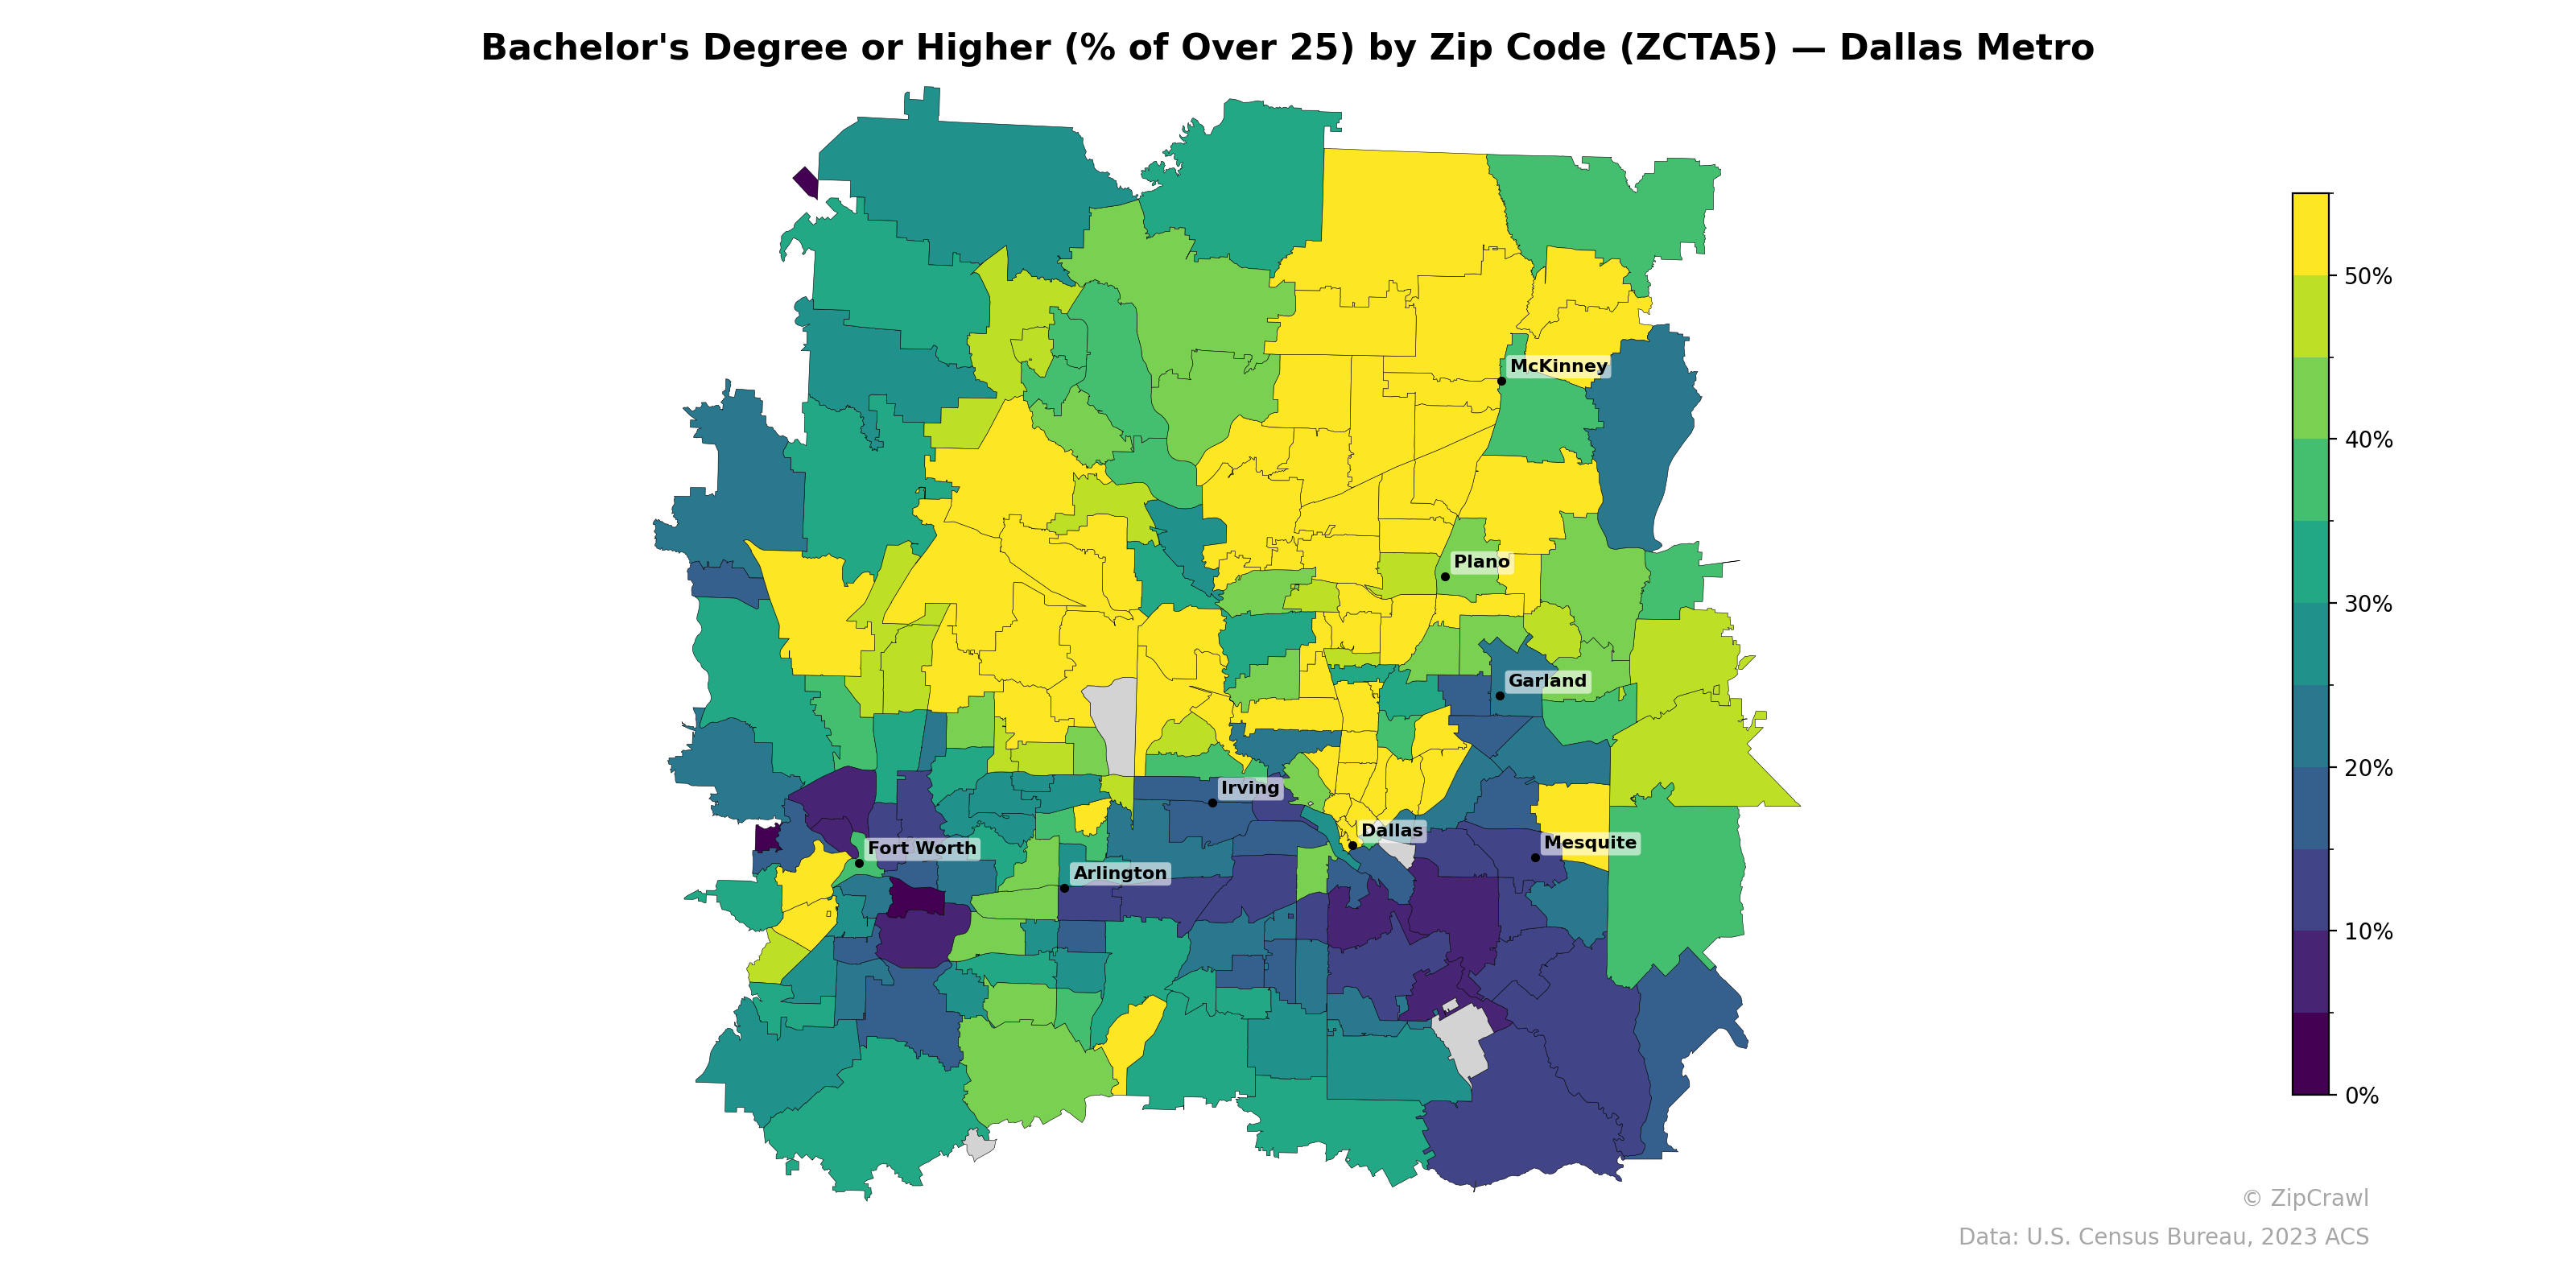
NOTE: Gray indicates insufficient data or a suppressed estimate.
The northern suburbs stretching from Plano through McKinney and into Collin County consistently exhibit the highest concentrations of bachelor's degree attainment, with many zip codes exceeding 50%, while a stark contrast emerges in southern Dallas County and parts of southeast Fort Worth where rates frequently drop below 15%. Central Dallas itself displays notable intra-city variation, with affluent enclaves like the Park Cities and North Dallas corridors registering high educational attainment adjacent to zip codes in South Dallas and Pleasant Grove that fall among the metro's lowest. The western portions of the metro around Fort Worth and Arlington generally occupy a middle band of 20–35%, though pockets of lower attainment cluster near downtown Fort Worth and along the I-30 corridor.
Data: U.S. Census Bureau, 2023 ACS
Explore
- Population Hispanic % by Zip Code (ZCTA5) — New York Metro
- Housing Vacancy Rate by Zip Code (ZCTA5) — Dallas Metro
- Housing % of Units Built Since 2010, by Zip Code (ZCTA5) — Dallas Metro
- % of Households with Broadband Internet, by Zip Code (ZCTA5) — Dallas Metro
- Household Average Size by Zip Code (ZCTA5) — Dallas Metro
- Housing Owner-Occupied % of Units, by Zip Code (ZCTA5) — Dallas Metro
- Married Couple (% of all Households) by Zip Code (ZCTA5) — Dallas Metro
- % of Population without Health Insurance, by Zip Code (ZCTA5) — Dallas Metro
- Housing Median Monthly Rent ($), by Zip Code (ZCTA5) — Dallas Metro
- Housing Owner-Occupied Median Value ($), by Zip Code (ZCTA5) — Dallas Metro
- Married Couple (% of all Households) by Zip Code (ZCTA5) — Iowa
- Median Age by County
- U.S. Citizens (% of Population Over 18) by Zip Code (ZCTA5) — New York Metro
- Population Non-Hispanic White % by Zip Code (ZCTA5) — New York Metro
- Population Non-Hispanic Black % by Zip Code (ZCTA5) — New York Metro
- Population Non-Hispanic American Indian % by Zip Code (ZCTA5) — New York Metro
- Household Median Income by Zip Code (ZCTA5) — New York Metro
- % of Population on Food Stamps or SNAP (Last 12 Months), by County
- Median Age by Zip Code (ZCTA5) — New York Metro
- High School Graduate (% of Over 25) by Zip Code (ZCTA5) — New York Metro
- Housing Median Monthly Rent ($), by Zip Code (ZCTA5) — Ohio
- Housing Owner-Occupied % of Units, by Zip Code (ZCTA5) — Ohio
- Housing % of Units Built Since 2010, by Zip Code (ZCTA5) — Ohio
- Population Non-Hispanic Black % by Zip Code (ZCTA5) — Ohio
- Population Hispanic % by Zip Code (ZCTA5) — Ohio
- Population Non-Hispanic American Indian % by Zip Code (ZCTA5) — Ohio
- % of Households with Broadband Internet, by Zip Code (ZCTA5) — Ohio
- % of Population without Health Insurance, by Zip Code (ZCTA5) — Ohio
- Housing Owner-Occupied Median Value ($), by Zip Code (ZCTA5) — Ohio
- Median Age by Zip Code (ZCTA5) — Ohio
- Bachelor's Degree or Higher (% of Over 25) by Zip Code (ZCTA5) — Denver Metro
- Bachelor's Degree or Higher (% of Over 25) by Zip Code (ZCTA5) — Detroit Metro
- Bachelor's Degree or Higher (% of Over 25) by Zip Code (ZCTA5) — Miami Metro
- Bachelor's Degree or Higher (% of Over 25) by Zip Code (ZCTA5) — Orlando Metro
- Bachelor's Degree or Higher (% of Over 25) by Zip Code (ZCTA5) — Boston Metro
- Bachelor's Degree or Higher (% of Over 25) by Zip Code (ZCTA5) — Tampa Metro
- Bachelor's Degree or Higher (% of Over 25) by Zip Code (ZCTA5) — Houston Metro
- Bachelor's Degree or Higher (% of Over 25) by Zip Code (ZCTA5) — Seattle Metro
- Bachelor's Degree or Higher (% of Over 25) by Zip Code (ZCTA5) — Chicago Metro
- Bachelor's Degree or Higher (% of Over 25) by Zip Code (ZCTA5) — Austin Metro