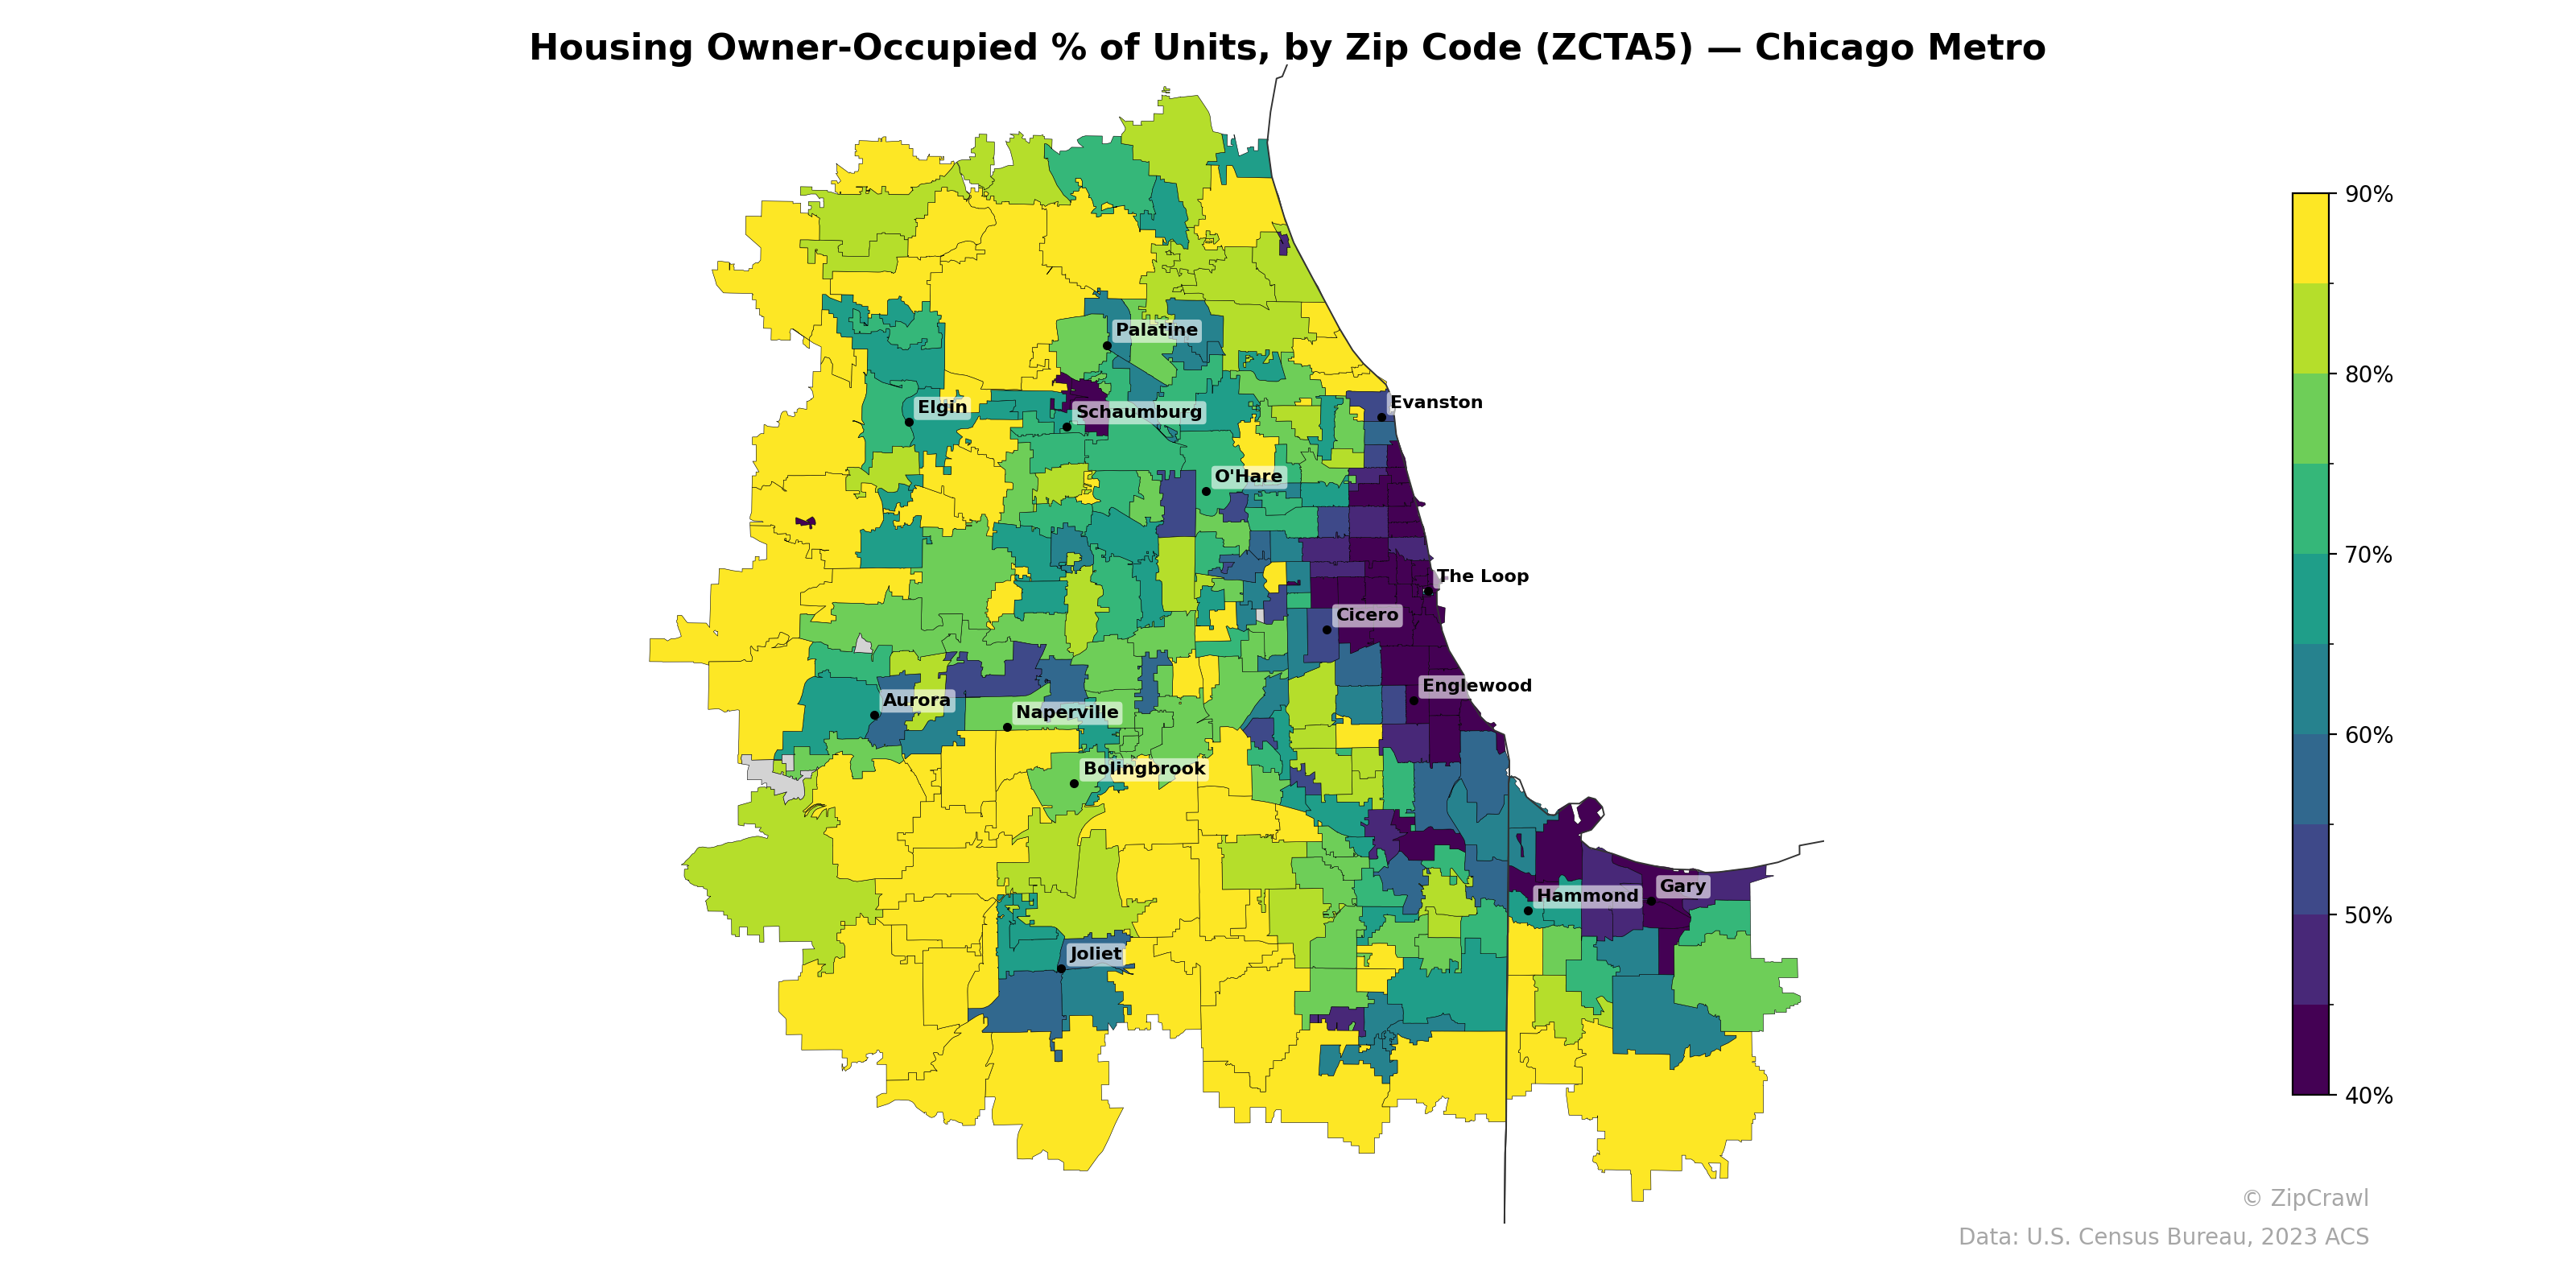
NOTE: Gray indicates insufficient data or a suppressed estimate.
Owner-occupancy rates exceed 80–90% across the outer suburban ring—particularly in the western and southwestern exurbs near Naperville, Bolingbrook, and Joliet—while dropping sharply below 50% in downtown Chicago near The Loop, along the South Side through Englewood, and in portions of Gary, Indiana. A clear urban-suburban gradient radiates outward from the city core, with the lowest ownership concentrations clustered along the lakefront corridor and in historically disinvested South and West Side neighborhoods. Scattered pockets of lower owner-occupancy also appear in inner-ring suburban nodes like Evanston, Cicero, and Elgin, likely reflecting higher concentrations of multifamily rental housing in those older, denser municipalities.
Data: U.S. Census Bureau, 2023 ACS
Explore
- Housing % of Units Built Since 2010, by Zip Code (ZCTA5) — San Diego Metro
- % of Households with Broadband Internet, by Zip Code (ZCTA5) — San Diego Metro
- Housing Median Monthly Rent ($), by Zip Code (ZCTA5) — San Diego Metro
- Housing Vacancy Rate by Zip Code (ZCTA5) — San Diego Metro
- Married Couple (% of all Households) by Zip Code (ZCTA5) — San Diego Metro
- Household Average Size by Zip Code (ZCTA5) — San Diego Metro
- % of Population without Health Insurance, by Zip Code (ZCTA5) — San Diego Metro
- Housing Owner-Occupied Median Value ($), by Zip Code (ZCTA5) — San Diego Metro
- Bachelor's Degree or Higher (% of Over 25) by Zip Code (ZCTA5) — San Diego Metro
- Population Non-Hispanic American Indian % by County
- Housing Vacancy Rate by Zip Code (ZCTA5) — Chicago Metro
- Housing Median Monthly Rent ($), by Zip Code (ZCTA5) — Chicago Metro
- Married Couple (% of all Households) by Zip Code (ZCTA5) — Chicago Metro
- Housing Owner-Occupied Median Value ($), by Zip Code (ZCTA5) — Chicago Metro
- Household Average Size by Zip Code (ZCTA5) — Chicago Metro
- Bachelor's Degree or Higher (% of Over 25) by Zip Code (ZCTA5) — Chicago Metro
- Housing % of Units Built Since 2010, by Zip Code (ZCTA5) — Chicago Metro
- % of Households with Broadband Internet, by Zip Code (ZCTA5) — Chicago Metro
- % of Population without Health Insurance, by Zip Code (ZCTA5) — Chicago Metro
- Household Average Size by Zip Code (ZCTA5) — Denver Metro
- Housing Owner-Occupied Median Value ($), by Zip Code (ZCTA5) — Denver Metro
- Married Couple (% of all Households) by Zip Code (ZCTA5) — Denver Metro
- Population Non-Hispanic American Indian % by Zip Code (ZCTA5) — Denver Metro
- Bachelor's Degree or Higher (% of Over 25) by Zip Code (ZCTA5) — Denver Metro
- Population Hispanic % by Zip Code (ZCTA5) — Denver Metro
- High School Graduate (% of Over 25) by Zip Code (ZCTA5) — Denver Metro
- Population Non-Hispanic White % by Zip Code (ZCTA5) — Denver Metro
- % of Population without Health Insurance, by Zip Code (ZCTA5) — Denver Metro
- Housing % of Units Built Since 2010, by Zip Code (ZCTA5) — Denver Metro
- Population Non-Hispanic Black % by Zip Code (ZCTA5) — Denver Metro
- Housing Owner-Occupied % of Units, by Zip Code (ZCTA5) — Houston Metro
- Housing Owner-Occupied % of Units, by Zip Code (ZCTA5) — Miami Metro
- Housing Owner-Occupied % of Units, by Zip Code (ZCTA5) — Tampa Metro
- Housing Owner-Occupied % of Units, by Zip Code (ZCTA5) — Detroit Metro
- Housing Owner-Occupied % of Units, by Zip Code (ZCTA5) — Denver Metro
- Housing Owner-Occupied % of Units, by Zip Code (ZCTA5) — Boston Metro
- Housing Owner-Occupied % of Units, by Zip Code (ZCTA5) — Charlotte Metro
- Housing Owner-Occupied % of Units, by Zip Code (ZCTA5) — Orlando Metro
- Housing Owner-Occupied % of Units, by Zip Code (ZCTA5) — Dallas Metro
- Housing Owner-Occupied % of Units, by Zip Code (ZCTA5) — Austin Metro