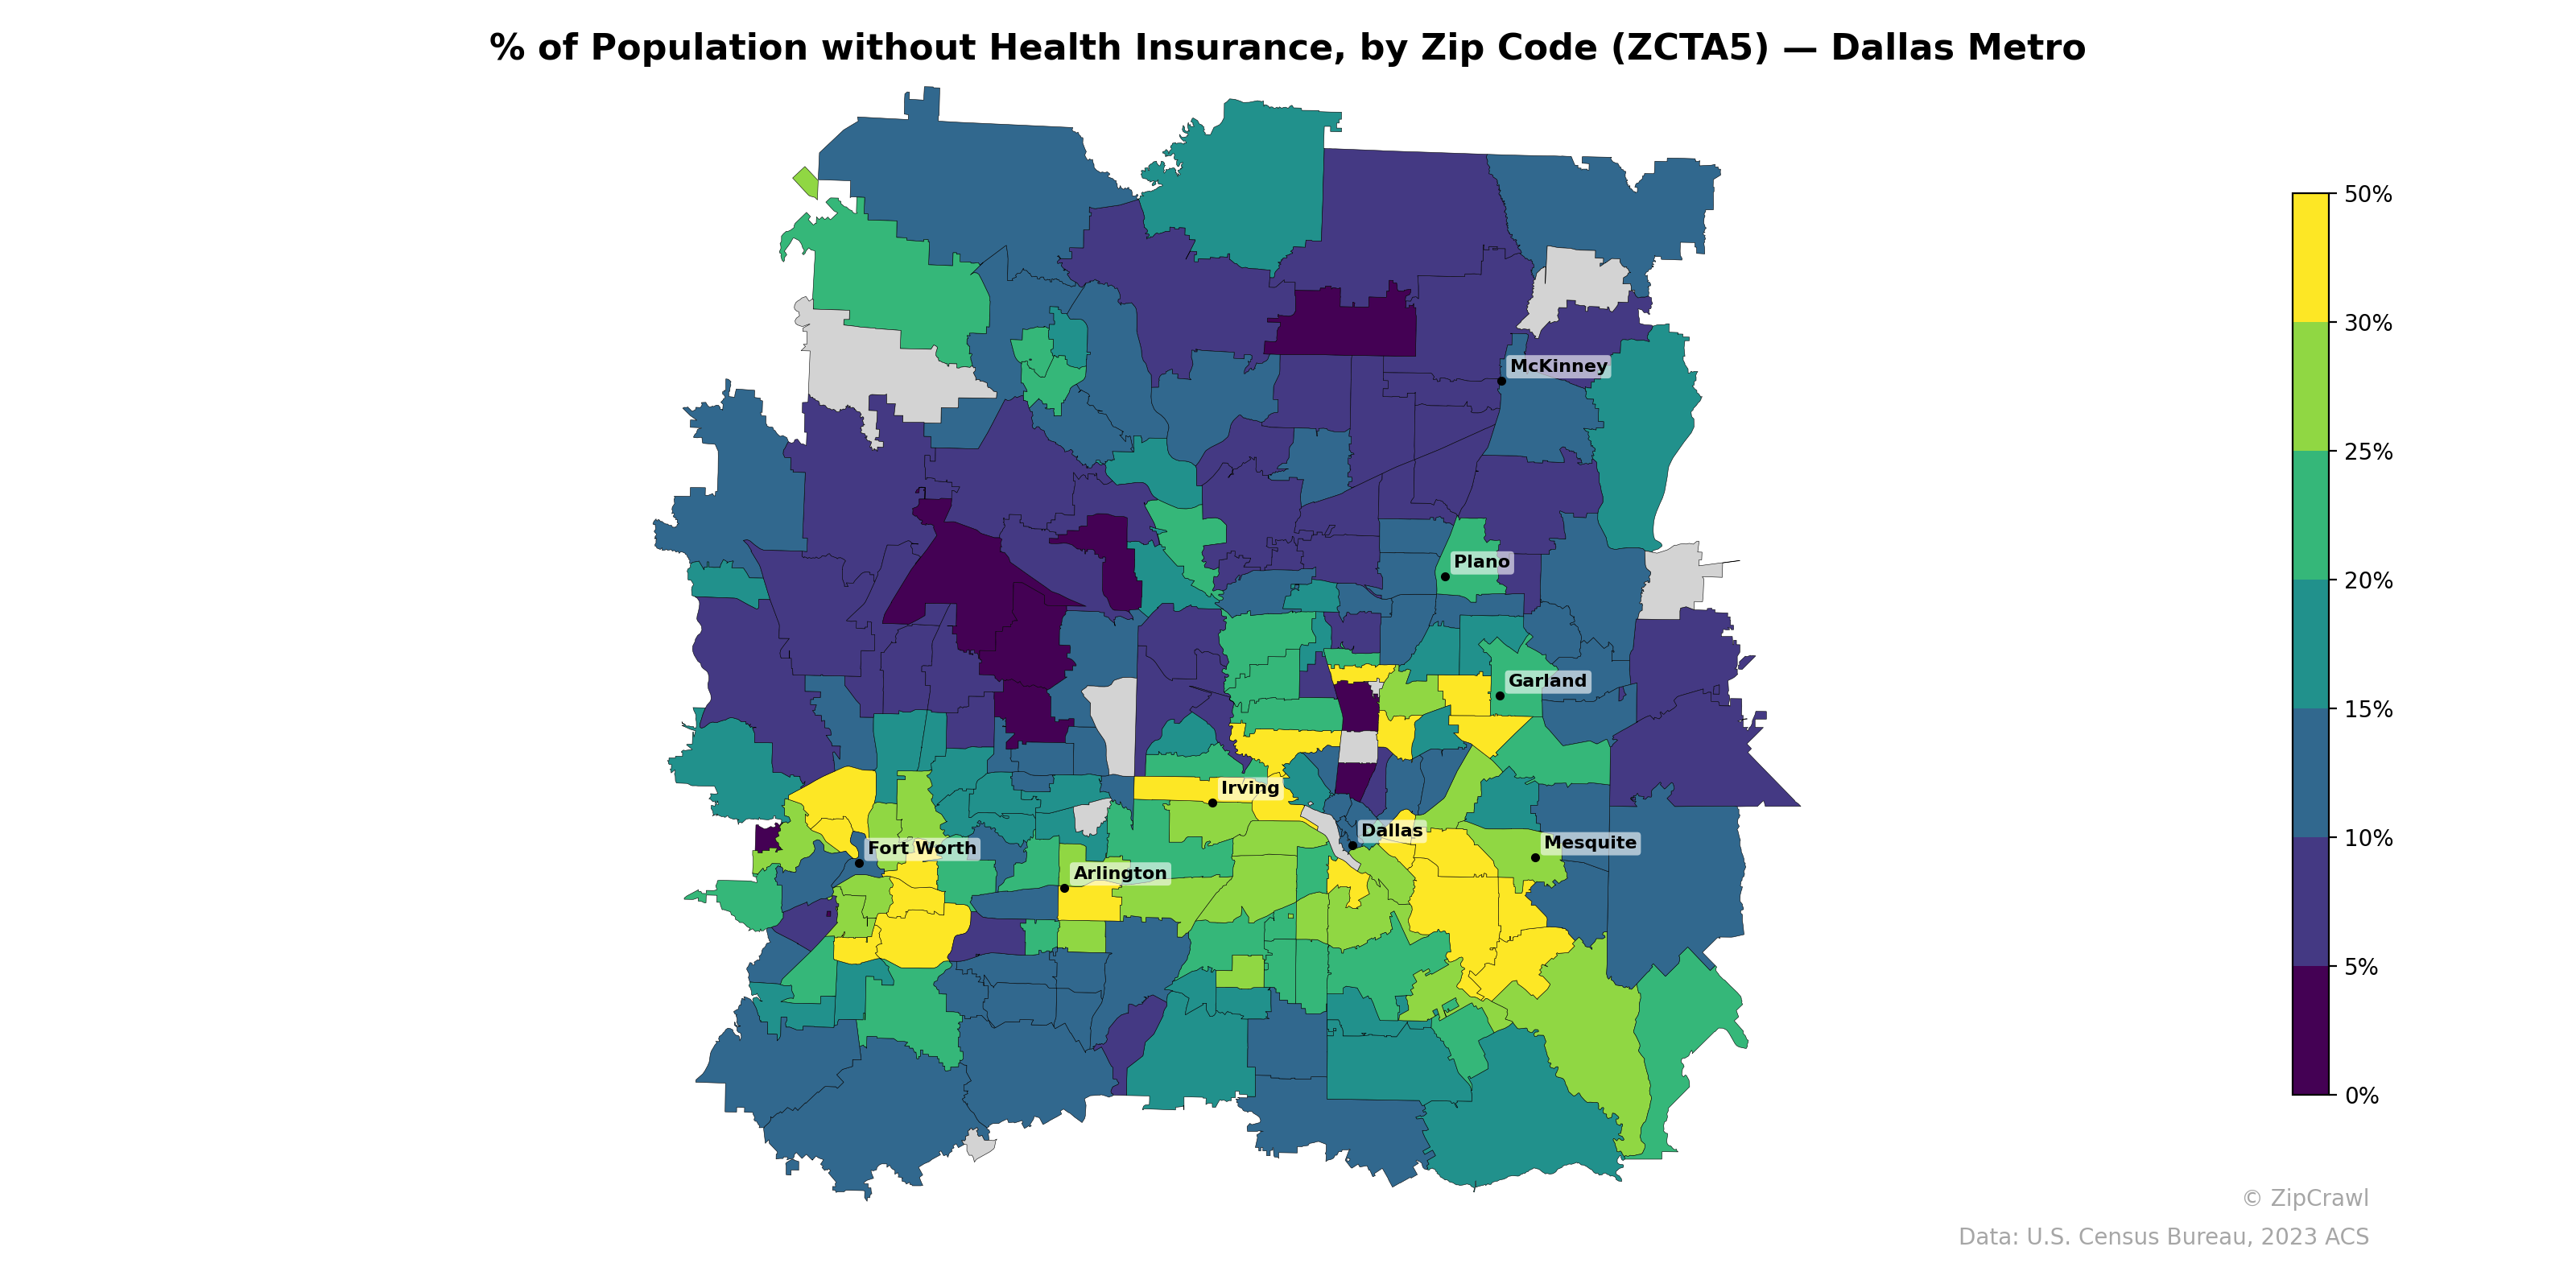
NOTE: Gray indicates insufficient data or a suppressed estimate.
Uninsured rates in the Dallas metro area exhibit a stark urban-core-to-suburb gradient, with zip codes in and immediately south of Dallas and the Fort Worth–Arlington corridor reaching 30–50%, while northern suburbs around Plano and McKinney generally fall below 15%. A concentrated band of high uninsurance stretches from central Dallas westward through Irving and into south Arlington, closely tracking areas with historically higher immigrant and lower-income populations. The outermost rural and exurban zip codes on the metro's periphery tend toward moderate uninsured rates (10–20%), distinguishing them from both the well-insured northern suburbs and the underinsured urban core.
Data: U.S. Census Bureau, 2023 ACS
Explore
- Population Hispanic % by Zip Code (ZCTA5) — New York Metro
- Housing Vacancy Rate by Zip Code (ZCTA5) — Dallas Metro
- Housing Owner-Occupied Median Value ($), by Zip Code (ZCTA5) — Dallas Metro
- Housing Median Monthly Rent ($), by Zip Code (ZCTA5) — Dallas Metro
- Married Couple (% of all Households) by Zip Code (ZCTA5) — Dallas Metro
- Household Average Size by Zip Code (ZCTA5) — Dallas Metro
- Housing % of Units Built Since 2010, by Zip Code (ZCTA5) — Dallas Metro
- Bachelor's Degree or Higher (% of Over 25) by Zip Code (ZCTA5) — Dallas Metro
- % of Households with Broadband Internet, by Zip Code (ZCTA5) — Dallas Metro
- Housing Owner-Occupied % of Units, by Zip Code (ZCTA5) — Dallas Metro
- Population Non-Hispanic Asian % by Zip Code (ZCTA5) — Iowa
- Median Age by County
- U.S. Citizens (% of Population Over 18) by Zip Code (ZCTA5) — New York Metro
- Population Non-Hispanic White % by Zip Code (ZCTA5) — New York Metro
- % of Population on Food Stamps or SNAP (Last 12 Months), by County
- Population Non-Hispanic Black % by Zip Code (ZCTA5) — New York Metro
- Median Age by Zip Code (ZCTA5) — New York Metro
- Population Non-Hispanic American Indian % by Zip Code (ZCTA5) — New York Metro
- Bachelor's Degree or Higher (% of Over 25) by Zip Code (ZCTA5) — New York Metro
- Household Median Income by Zip Code (ZCTA5) — New York Metro
- High School Graduate (% of Over 25) by Zip Code (ZCTA5) — New York Metro
- Housing Owner-Occupied Median Value ($), by Zip Code (ZCTA5) — Ohio
- % of Households with Broadband Internet, by Zip Code (ZCTA5) — Ohio
- Housing Median Monthly Rent ($), by Zip Code (ZCTA5) — Ohio
- Population Hispanic % by Zip Code (ZCTA5) — Ohio
- Population Non-Hispanic White % by Zip Code (ZCTA5) — Ohio
- High School Graduate (% of Over 25) by Zip Code (ZCTA5) — Ohio
- Bachelor's Degree or Higher (% of Over 25) by Zip Code (ZCTA5) — Ohio
- Housing Owner-Occupied % of Units, by Zip Code (ZCTA5) — Ohio
- Population Non-Hispanic Black % by Zip Code (ZCTA5) — Ohio
- % of Population without Health Insurance, by Zip Code (ZCTA5) — Detroit Metro
- % of Population without Health Insurance, by Zip Code (ZCTA5) — Denver Metro
- % of Population without Health Insurance, by Zip Code (ZCTA5) — Houston Metro
- % of Population without Health Insurance, by Zip Code (ZCTA5) — Boston Metro
- % of Population without Health Insurance, by Zip Code (ZCTA5) — Miami Metro
- % of Population without Health Insurance, by Zip Code (ZCTA5) — Tampa Metro
- % of Population without Health Insurance, by Zip Code (ZCTA5) — Chicago Metro
- % of Population without Health Insurance, by Zip Code (ZCTA5) — Orlando Metro
- % of Population without Health Insurance, by Zip Code (ZCTA5) — Phoenix Metro
- % of Population without Health Insurance, by Zip Code (ZCTA5) — Austin Metro