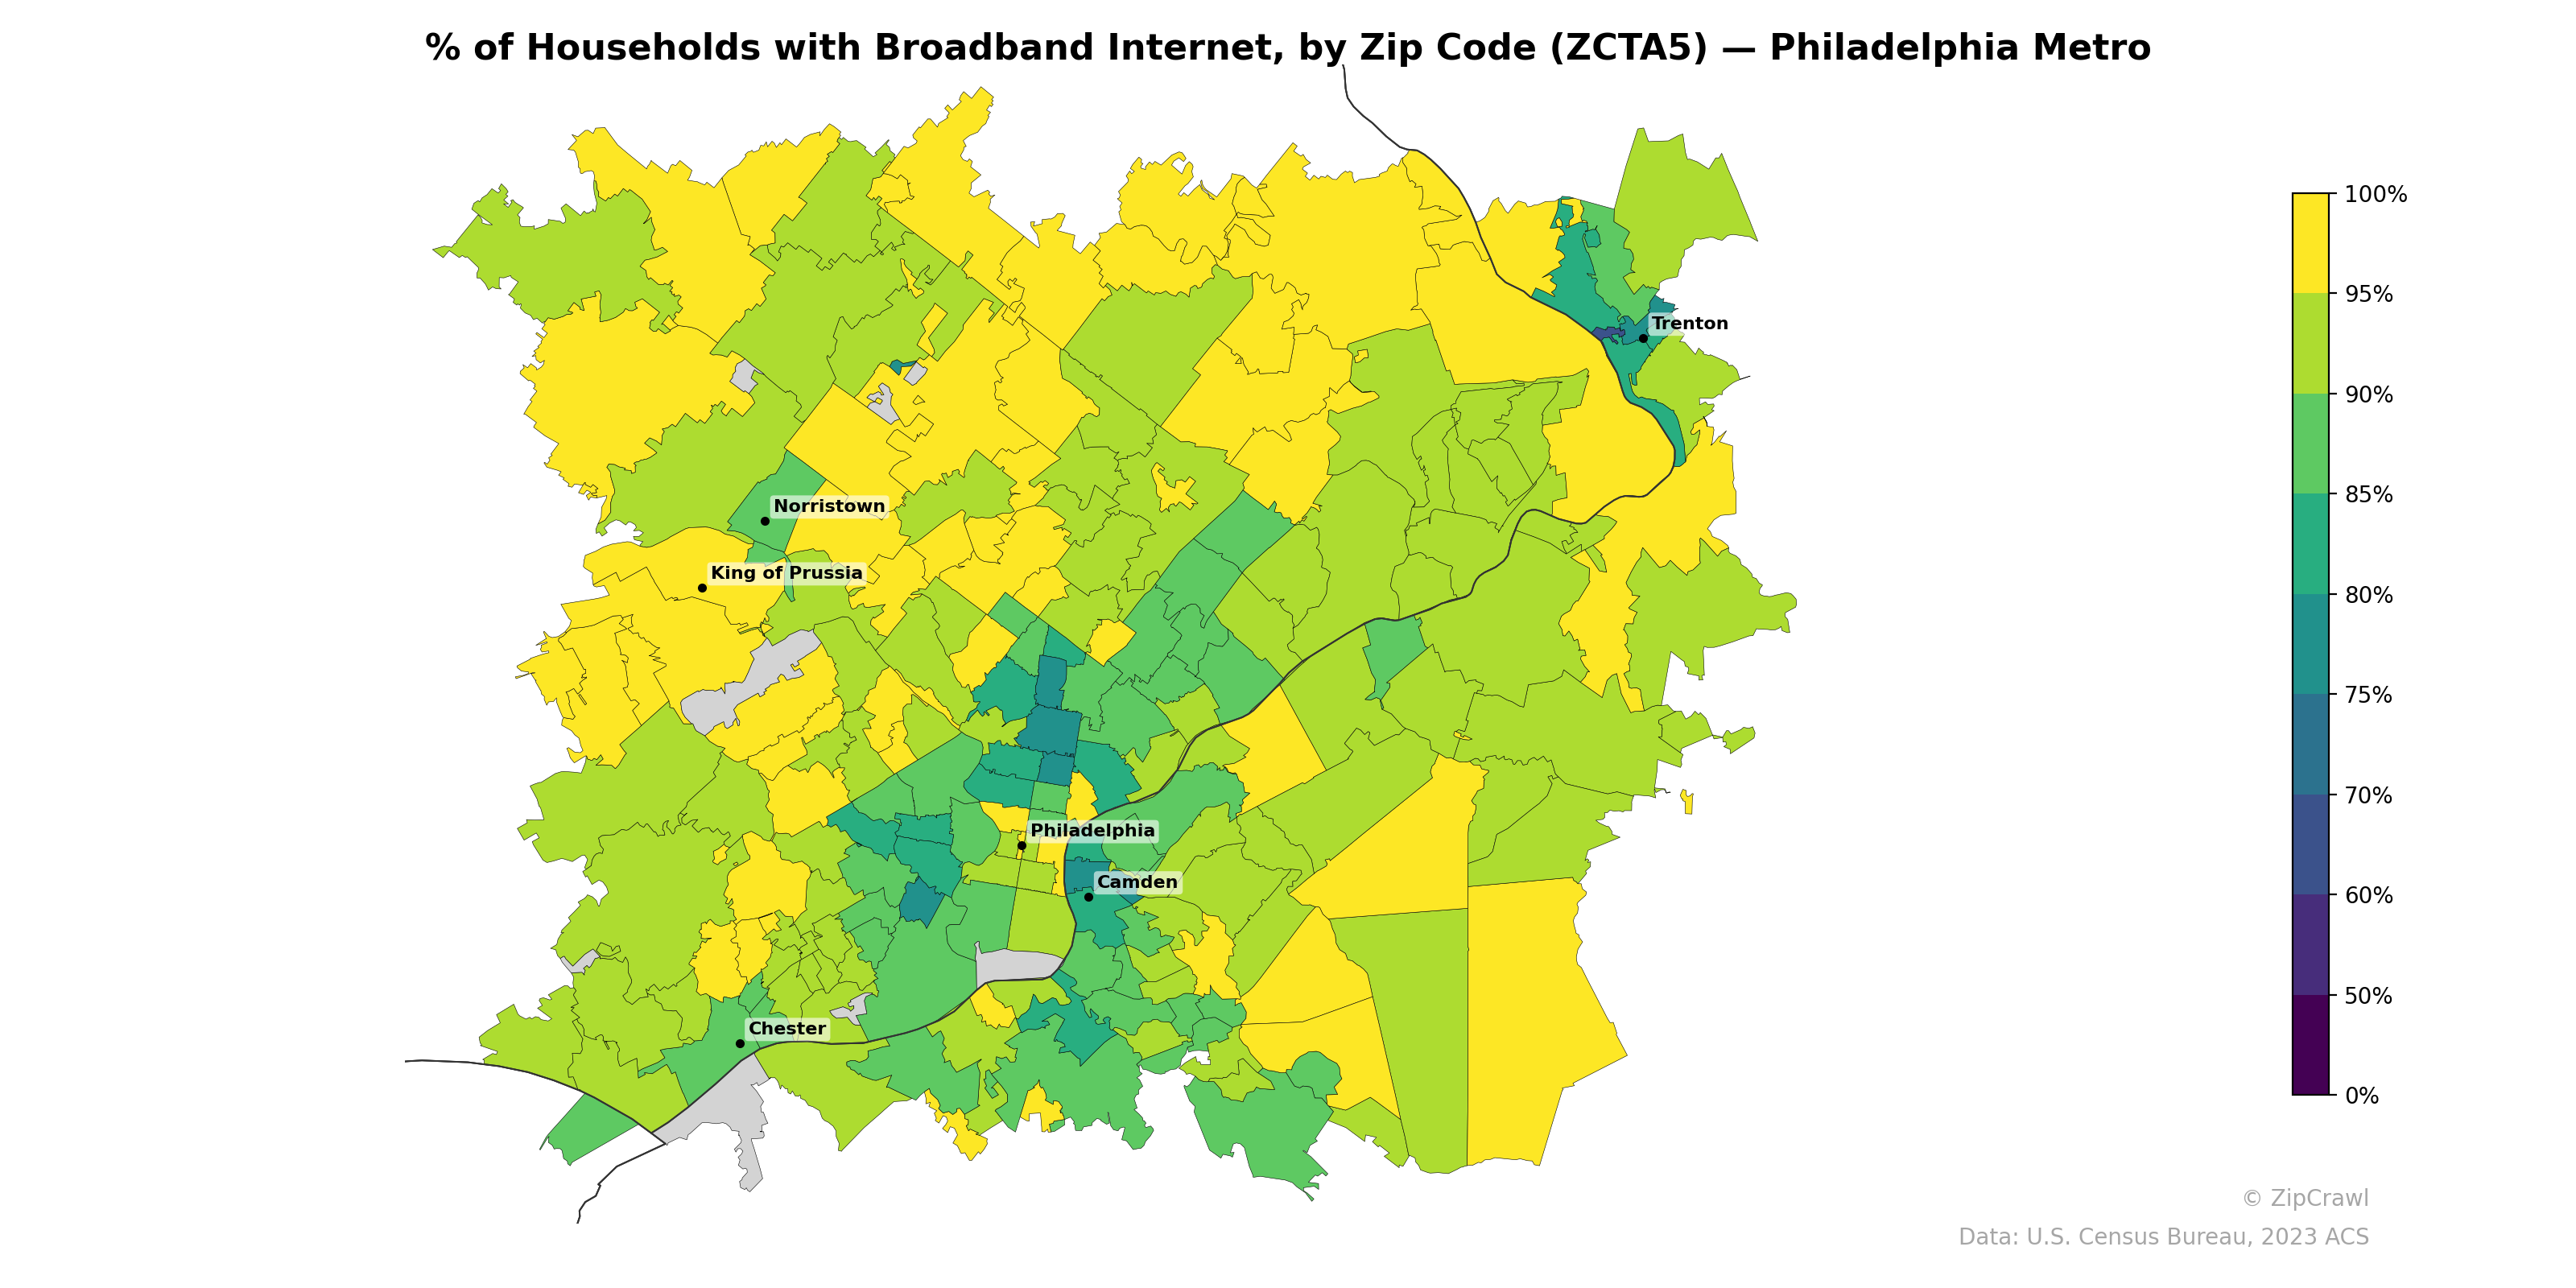
NOTE: Gray indicates insufficient data or a suppressed estimate.
Broadband adoption rates across the Philadelphia metro area exhibit a pronounced urban-suburban divide, with the lowest penetration rates—falling below 65%—concentrated in North and West Philadelphia zip codes as well as in Camden and Chester, forming a corridor of digital disadvantage through the region's urban core. Suburban zip codes to the northwest toward King of Prussia, north toward Bucks County, and east into southern New Jersey consistently exceed 90% broadband adoption, with many reaching near-universal coverage above 95%. The Norristown area represents a notable suburban exception, displaying moderately lower broadband rates compared to its surrounding affluent communities, suggesting localized socioeconomic factors influencing connectivity even outside the central city.
Data: U.S. Census Bureau, 2023 ACS
Explore
- Household Average Size by Zip Code (ZCTA5) — Philadelphia Metro
- Housing Owner-Occupied Median Value ($), by Zip Code (ZCTA5) — Philadelphia Metro
- Married Couple (% of all Households) by Zip Code (ZCTA5) — Philadelphia Metro
- Housing % of Units Built Since 2010, by Zip Code (ZCTA5) — Philadelphia Metro
- Housing Vacancy Rate by Zip Code (ZCTA5) — Philadelphia Metro
- Housing Median Monthly Rent ($), by Zip Code (ZCTA5) — Philadelphia Metro
- % of Population without Health Insurance, by Zip Code (ZCTA5) — Philadelphia Metro
- Housing Owner-Occupied % of Units, by Zip Code (ZCTA5) — Philadelphia Metro
- Bachelor's Degree or Higher (% of Over 25) by Zip Code (ZCTA5) — Philadelphia Metro
- Housing Vacancy Rate by Zip Code (ZCTA5) — West Virginia
- Population Hispanic % by County
- High School Graduate (% of Over 25) by Zip Code (ZCTA5) — Los Angeles Metro
- Population Non-Hispanic American Indian % by Zip Code (ZCTA5) — Los Angeles Metro
- Housing Owner-Occupied % of Units, by County
- Population Hispanic % by Zip Code (ZCTA5) — Los Angeles Metro
- Population Non-Hispanic Black % by Zip Code (ZCTA5) — Los Angeles Metro
- % of Population on Food Stamps or SNAP (Last 12 Months), by Zip Code (ZCTA5) — New York Metro
- Median Age by Zip Code (ZCTA5) — Los Angeles Metro
- U.S. Citizens (% of Population Over 18) by Zip Code (ZCTA5) — Los Angeles Metro
- Population Non-Hispanic White % by Zip Code (ZCTA5) — Los Angeles Metro
- Household Median Income by Zip Code (ZCTA5) — Los Angeles Metro
- Housing % of Units Built Since 2010, by Zip Code (ZCTA5) — Virginia
- Housing Owner-Occupied Median Value ($), by Zip Code (ZCTA5) — Virginia
- Household Average Size by Zip Code (ZCTA5) — Virginia
- Population Non-Hispanic American Indian % by Zip Code (ZCTA5) — Virginia
- Population Non-Hispanic Black % by Zip Code (ZCTA5) — Virginia
- % of Population without Health Insurance, by Zip Code (ZCTA5) — Virginia
- Housing Owner-Occupied % of Units, by Zip Code (ZCTA5) — Virginia
- Housing Median Monthly Rent ($), by Zip Code (ZCTA5) — Virginia
- High School Graduate (% of Over 25) by Zip Code (ZCTA5) — Virginia
- % of Households with Broadband Internet, by Zip Code (ZCTA5) — Phoenix Metro
- % of Households with Broadband Internet, by Zip Code (ZCTA5) — Houston Metro
- % of Households with Broadband Internet, by Zip Code (ZCTA5) — Portland Metro
- % of Households with Broadband Internet, by Zip Code (ZCTA5) — Miami Metro
- % of Households with Broadband Internet, by Zip Code (ZCTA5) — Boston Metro
- % of Households with Broadband Internet, by Zip Code (ZCTA5) — Orlando Metro
- % of Households with Broadband Internet, by Zip Code (ZCTA5) — Detroit Metro
- % of Households with Broadband Internet, by Zip Code (ZCTA5) — Tampa Metro
- % of Households with Broadband Internet, by Zip Code (ZCTA5) — Dallas Metro
- % of Households with Broadband Internet, by Zip Code (ZCTA5) — Chicago Metro