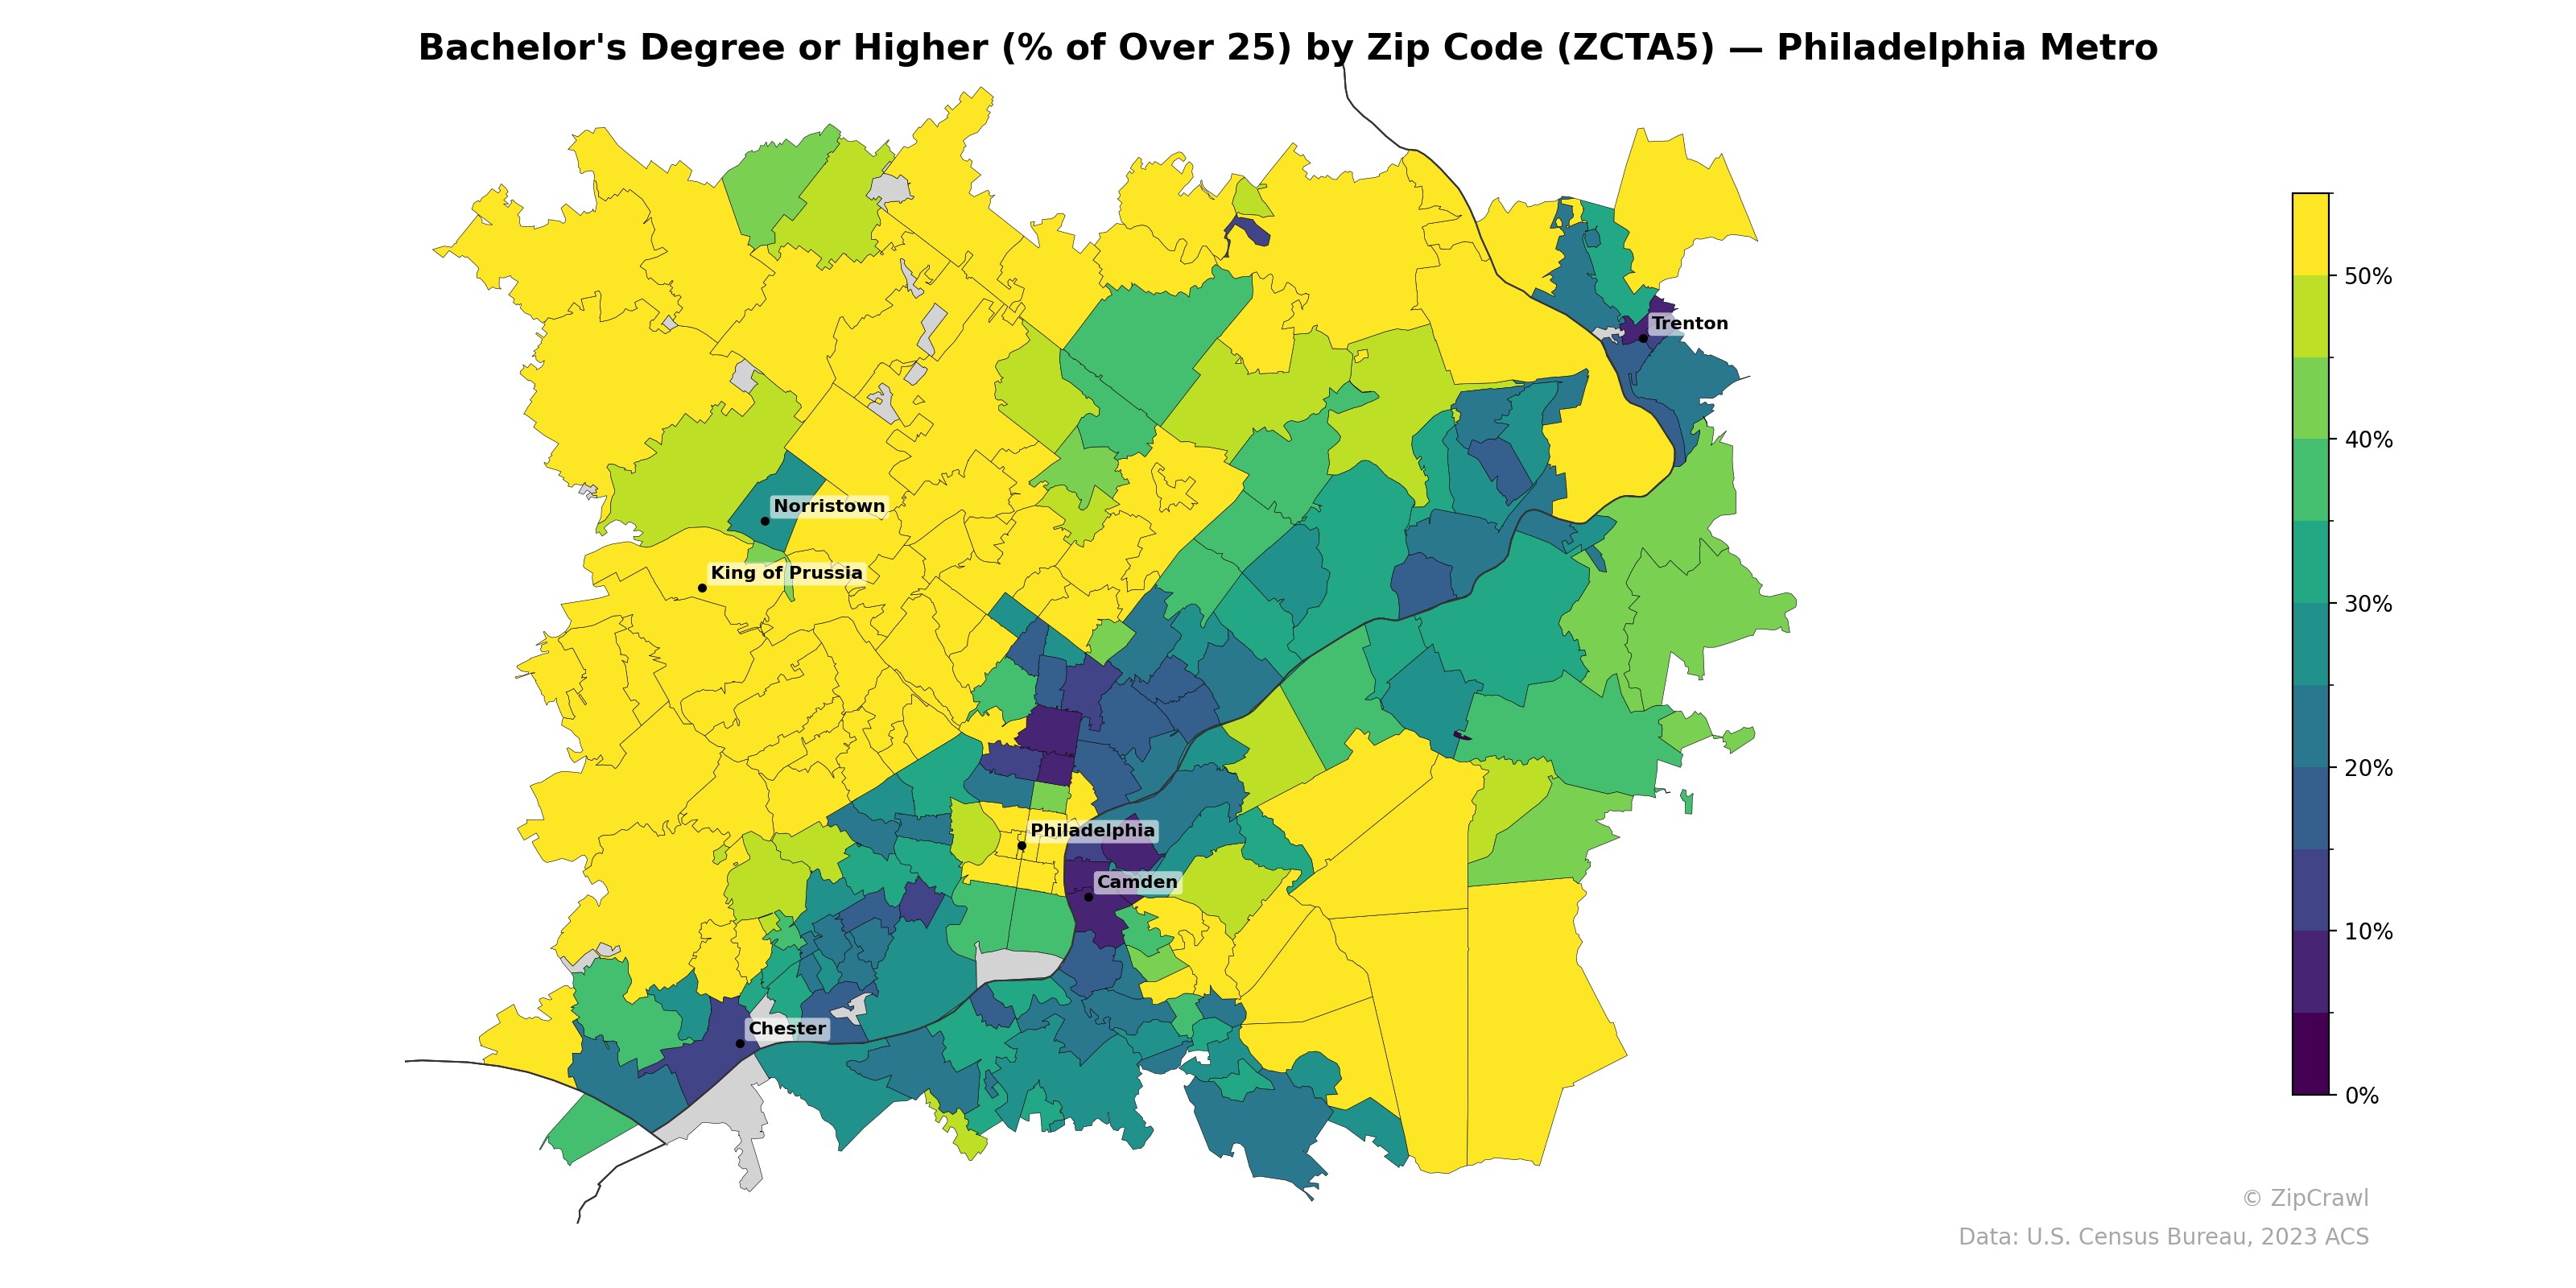
NOTE: Gray indicates insufficient data or a suppressed estimate.
The suburban arc west and northwest of Philadelphia—particularly zip codes near King of Prussia and extending through much of Chester and Montgomery counties—exhibits consistently high bachelor's degree attainment, often exceeding 50%, while urban core zip codes in Philadelphia, Camden, Chester, and Trenton cluster well below 15%. A notable corridor of high educational attainment cuts through Philadelphia's Center City and extends northwest along the Main Line, creating a sharp contrast with adjacent neighborhoods just a few zip codes away. The New Jersey side of the metro shows more variability, with pockets of higher attainment in outer suburban areas giving way to markedly lower rates near Trenton and Camden.
Data: U.S. Census Bureau, 2023 ACS
Explore
- Household Average Size by Zip Code (ZCTA5) — Philadelphia Metro
- Housing % of Units Built Since 2010, by Zip Code (ZCTA5) — Philadelphia Metro
- Housing Vacancy Rate by Zip Code (ZCTA5) — Philadelphia Metro
- Married Couple (% of all Households) by Zip Code (ZCTA5) — Philadelphia Metro
- % of Households with Broadband Internet, by Zip Code (ZCTA5) — Philadelphia Metro
- Housing Median Monthly Rent ($), by Zip Code (ZCTA5) — Philadelphia Metro
- Housing Owner-Occupied Median Value ($), by Zip Code (ZCTA5) — Philadelphia Metro
- Housing Owner-Occupied % of Units, by Zip Code (ZCTA5) — Philadelphia Metro
- % of Population without Health Insurance, by Zip Code (ZCTA5) — Philadelphia Metro
- Married Couple (% of all Households) by Zip Code (ZCTA5) — West Virginia
- Population Hispanic % by County
- High School Graduate (% of Over 25) by Zip Code (ZCTA5) — Los Angeles Metro
- Population Non-Hispanic White % by Zip Code (ZCTA5) — Los Angeles Metro
- Population Non-Hispanic American Indian % by Zip Code (ZCTA5) — Los Angeles Metro
- % of Households with Broadband Internet, by County
- % of Population on Food Stamps or SNAP (Last 12 Months), by Zip Code (ZCTA5) — New York Metro
- U.S. Citizens (% of Population Over 18) by Zip Code (ZCTA5) — Los Angeles Metro
- Population Non-Hispanic Black % by Zip Code (ZCTA5) — Los Angeles Metro
- Household Median Income by Zip Code (ZCTA5) — Los Angeles Metro
- Population Hispanic % by Zip Code (ZCTA5) — Los Angeles Metro
- Median Age by Zip Code (ZCTA5) — Los Angeles Metro
- Household Average Size by Zip Code (ZCTA5) — Virginia
- Housing Median Monthly Rent ($), by Zip Code (ZCTA5) — Virginia
- Married Couple (% of all Households) by Zip Code (ZCTA5) — Virginia
- High School Graduate (% of Over 25) by Zip Code (ZCTA5) — Virginia
- Population Non-Hispanic American Indian % by Zip Code (ZCTA5) — Virginia
- Housing Owner-Occupied % of Units, by Zip Code (ZCTA5) — Virginia
- Housing Owner-Occupied Median Value ($), by Zip Code (ZCTA5) — Virginia
- Housing % of Units Built Since 2010, by Zip Code (ZCTA5) — Virginia
- % of Households with Broadband Internet, by Zip Code (ZCTA5) — Virginia
- Bachelor's Degree or Higher (% of Over 25) by Zip Code (ZCTA5) — Denver Metro
- Bachelor's Degree or Higher (% of Over 25) by Zip Code (ZCTA5) — Phoenix Metro
- Bachelor's Degree or Higher (% of Over 25) by Zip Code (ZCTA5) — Detroit Metro
- Bachelor's Degree or Higher (% of Over 25) by Zip Code (ZCTA5) — Miami Metro
- Bachelor's Degree or Higher (% of Over 25) by Zip Code (ZCTA5) — Orlando Metro
- Bachelor's Degree or Higher (% of Over 25) by Zip Code (ZCTA5) — Dallas Metro
- Bachelor's Degree or Higher (% of Over 25) by Zip Code (ZCTA5) — Boston Metro
- Bachelor's Degree or Higher (% of Over 25) by Zip Code (ZCTA5) — Tampa Metro
- Bachelor's Degree or Higher (% of Over 25) by Zip Code (ZCTA5) — Portland Metro
- Bachelor's Degree or Higher (% of Over 25) by Zip Code (ZCTA5) — Houston Metro