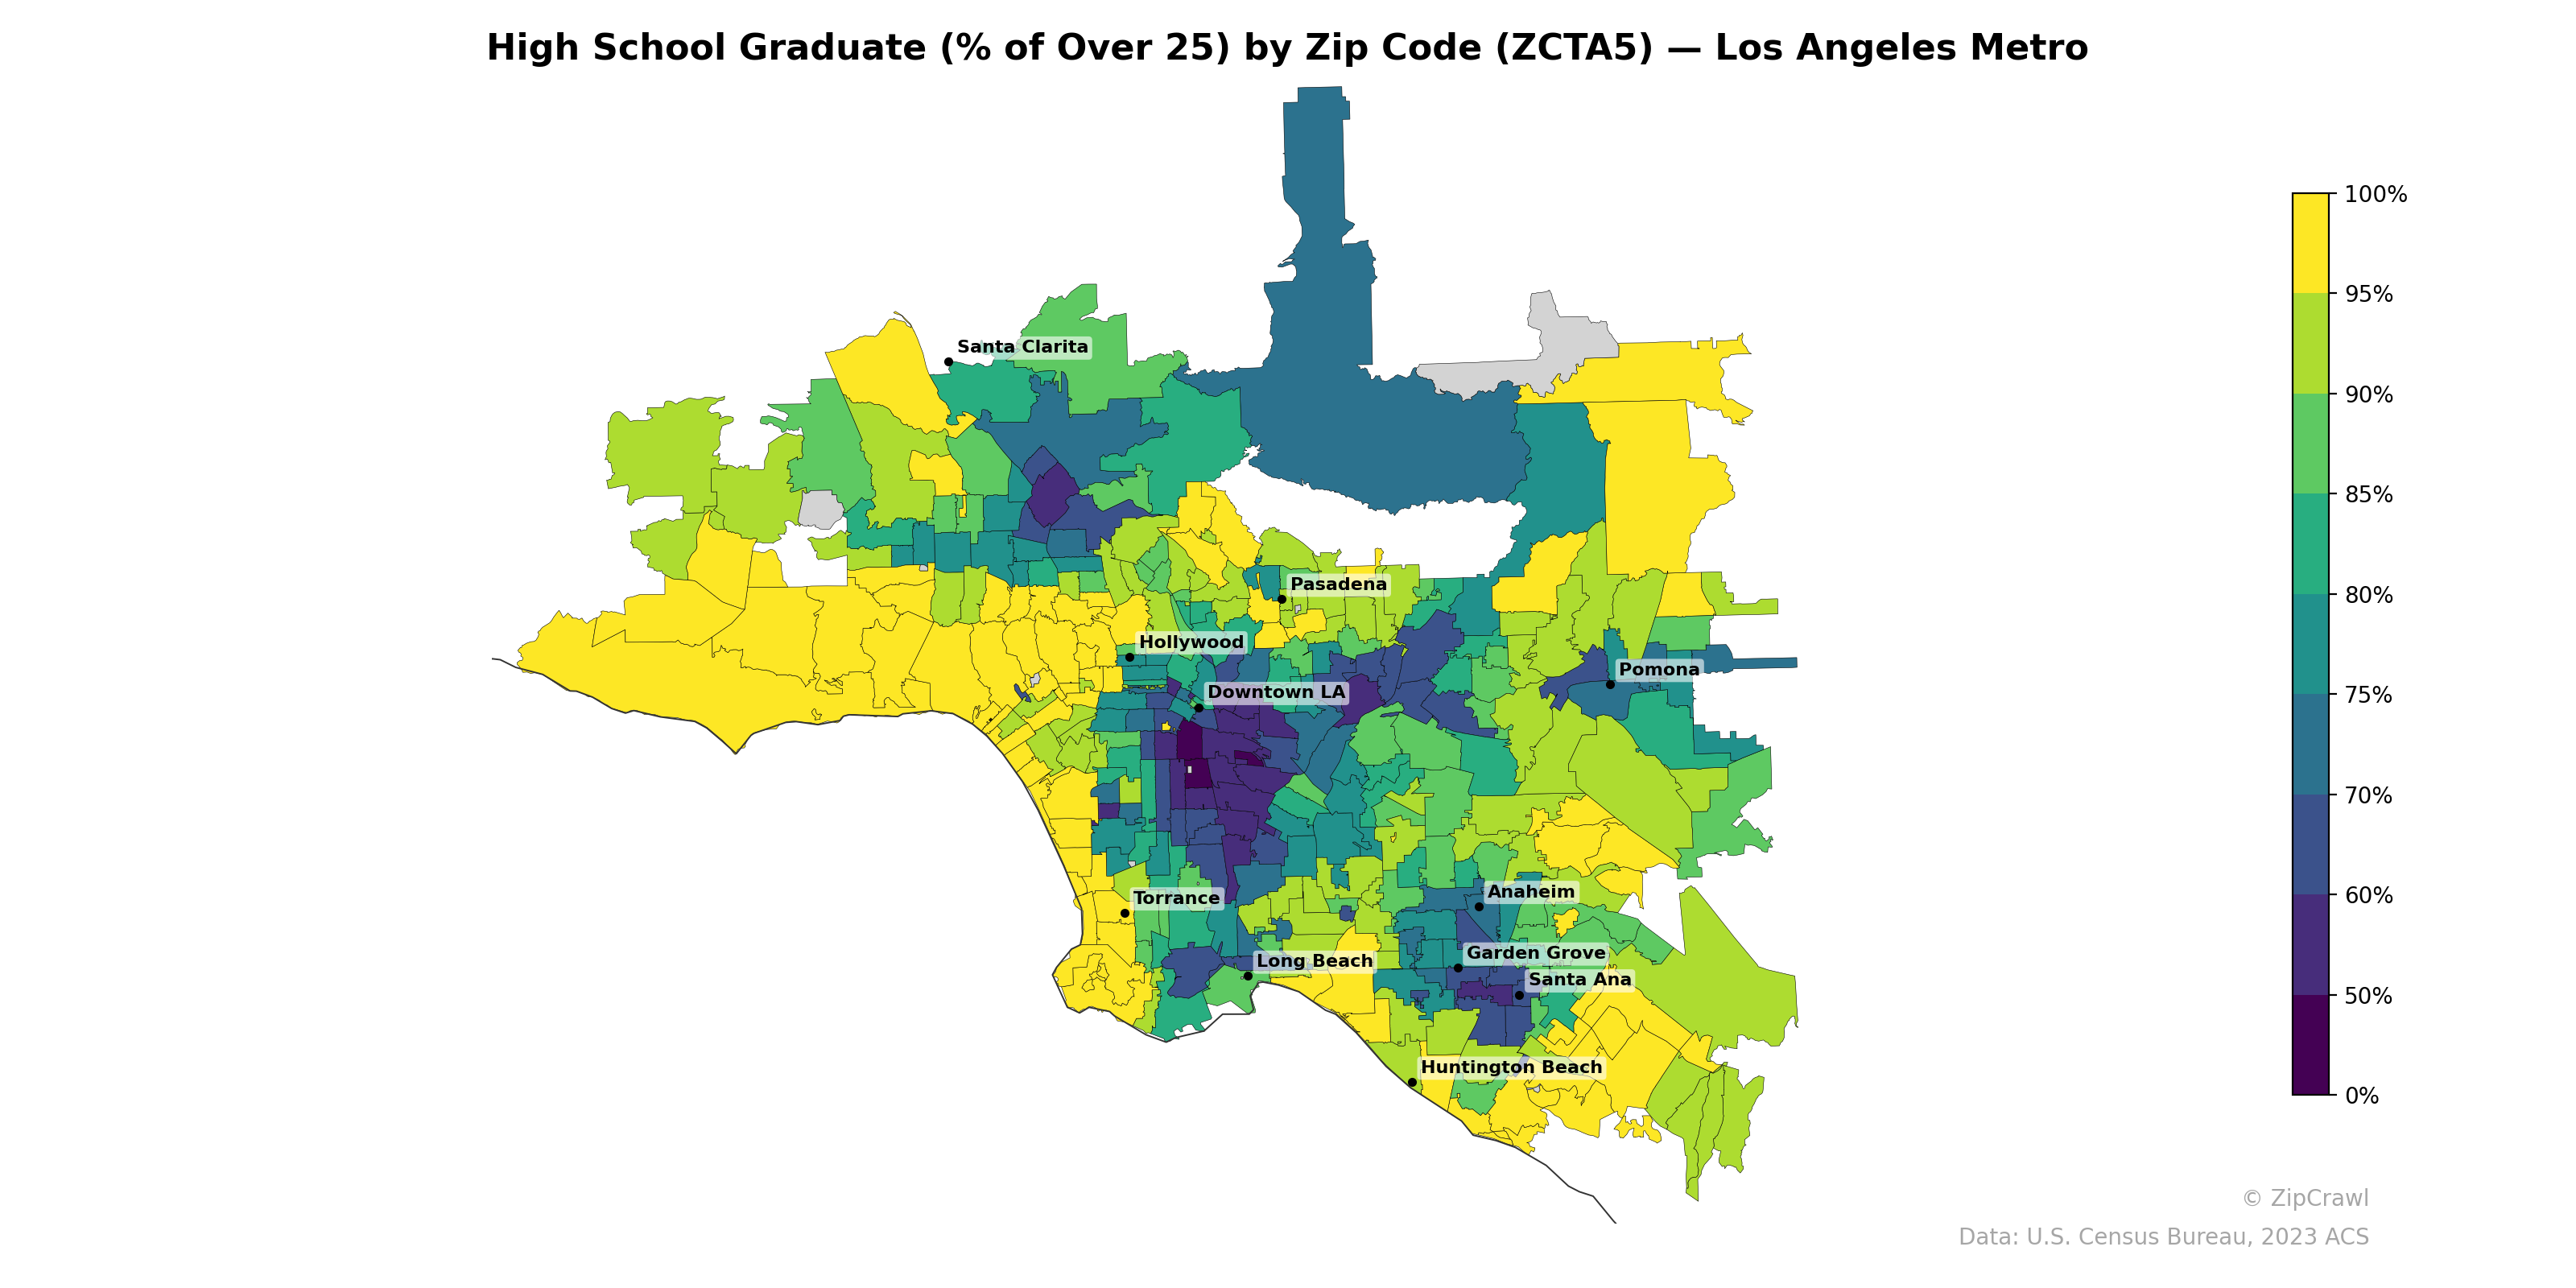
NOTE: Gray indicates insufficient data or a suppressed estimate.
Zip codes in the western and northern periphery of the metro—particularly near Santa Clarita, Torrance, and Huntington Beach—consistently report high school graduation rates above 90%, while a concentrated band of lower attainment (below 60%) runs through South Los Angeles and parts of central LA near Downtown. Orange County displays notable internal contrast, with Santa Ana zip codes falling well below surrounding areas like Anaheim and Garden Grove, which trend closer to 75–85%. The San Gabriel Valley and foothill communities east of Pasadena show a sharp east-west gradient, transitioning from higher rates near the mountains to lower rates approaching Pomona.
Data: U.S. Census Bureau, 2023 ACS
Explore
- Married Couple (% of all Households) by Zip Code (ZCTA5) — Arizona
- Housing Vacancy Rate by Zip Code (ZCTA5) — Arizona
- Housing % of Units Built Since 2010, by Zip Code (ZCTA5) — Arizona
- % of Population without Health Insurance, by Zip Code (ZCTA5) — Arizona
- Household Average Size by Zip Code (ZCTA5) — Arizona
- % of Households with Broadband Internet, by Zip Code (ZCTA5) — Arizona
- Bachelor's Degree or Higher (% of Over 25) by Zip Code (ZCTA5) — Arizona
- Housing Owner-Occupied Median Value ($), by Zip Code (ZCTA5) — Arizona
- Housing Median Monthly Rent ($), by Zip Code (ZCTA5) — Arizona
- Housing Owner-Occupied % of Units, by Zip Code (ZCTA5) — Arizona
- Population Hispanic % by County
- Population Hispanic % by Zip Code (ZCTA5) — Los Angeles Metro
- Population Non-Hispanic White % by Zip Code (ZCTA5) — Los Angeles Metro
- Population Non-Hispanic American Indian % by Zip Code (ZCTA5) — Los Angeles Metro
- % of Population on Food Stamps or SNAP (Last 12 Months), by Zip Code (ZCTA5) — New York Metro
- Median Age by Zip Code (ZCTA5) — Los Angeles Metro
- U.S. Citizens (% of Population Over 18) by Zip Code (ZCTA5) — Los Angeles Metro
- Population Non-Hispanic Black % by Zip Code (ZCTA5) — Los Angeles Metro
- Household Median Income by Zip Code (ZCTA5) — Los Angeles Metro
- Housing Vacancy Rate by Zip Code (ZCTA5) — Virginia
- Household Average Size by Zip Code (ZCTA5) — Virginia
- Population Non-Hispanic Asian % by Zip Code (ZCTA5) — Virginia
- % of Households with Broadband Internet, by Zip Code (ZCTA5) — Virginia
- Housing Owner-Occupied % of Units, by Zip Code (ZCTA5) — Virginia
- Population Non-Hispanic American Indian % by Zip Code (ZCTA5) — Virginia
- % of Population without Health Insurance, by Zip Code (ZCTA5) — Virginia
- Housing Median Monthly Rent ($), by Zip Code (ZCTA5) — Virginia
- Housing % of Units Built Since 2010, by Zip Code (ZCTA5) — Virginia
- Married Couple (% of all Households) by Zip Code (ZCTA5) — Virginia
- Population Non-Hispanic Black % by Zip Code (ZCTA5) — Virginia
- High School Graduate (% of Over 25) by Zip Code (ZCTA5) — St. Louis Metro
- High School Graduate (% of Over 25) by Zip Code (ZCTA5) — Austin Metro
- High School Graduate (% of Over 25) by Zip Code (ZCTA5) — Miami Metro
- High School Graduate (% of Over 25) by Zip Code (ZCTA5) — Denver Metro
- High School Graduate (% of Over 25) by Zip Code (ZCTA5) — Atlanta Metro
- High School Graduate (% of Over 25) by Zip Code (ZCTA5) — Boston Metro
- High School Graduate (% of Over 25) by Zip Code (ZCTA5) — Detroit Metro
- High School Graduate (% of Over 25) by Zip Code (ZCTA5) — Tampa Metro
- High School Graduate (% of Over 25) by Zip Code (ZCTA5) — San Antonio Metro
- High School Graduate (% of Over 25) by Zip Code (ZCTA5) — Dallas Metro