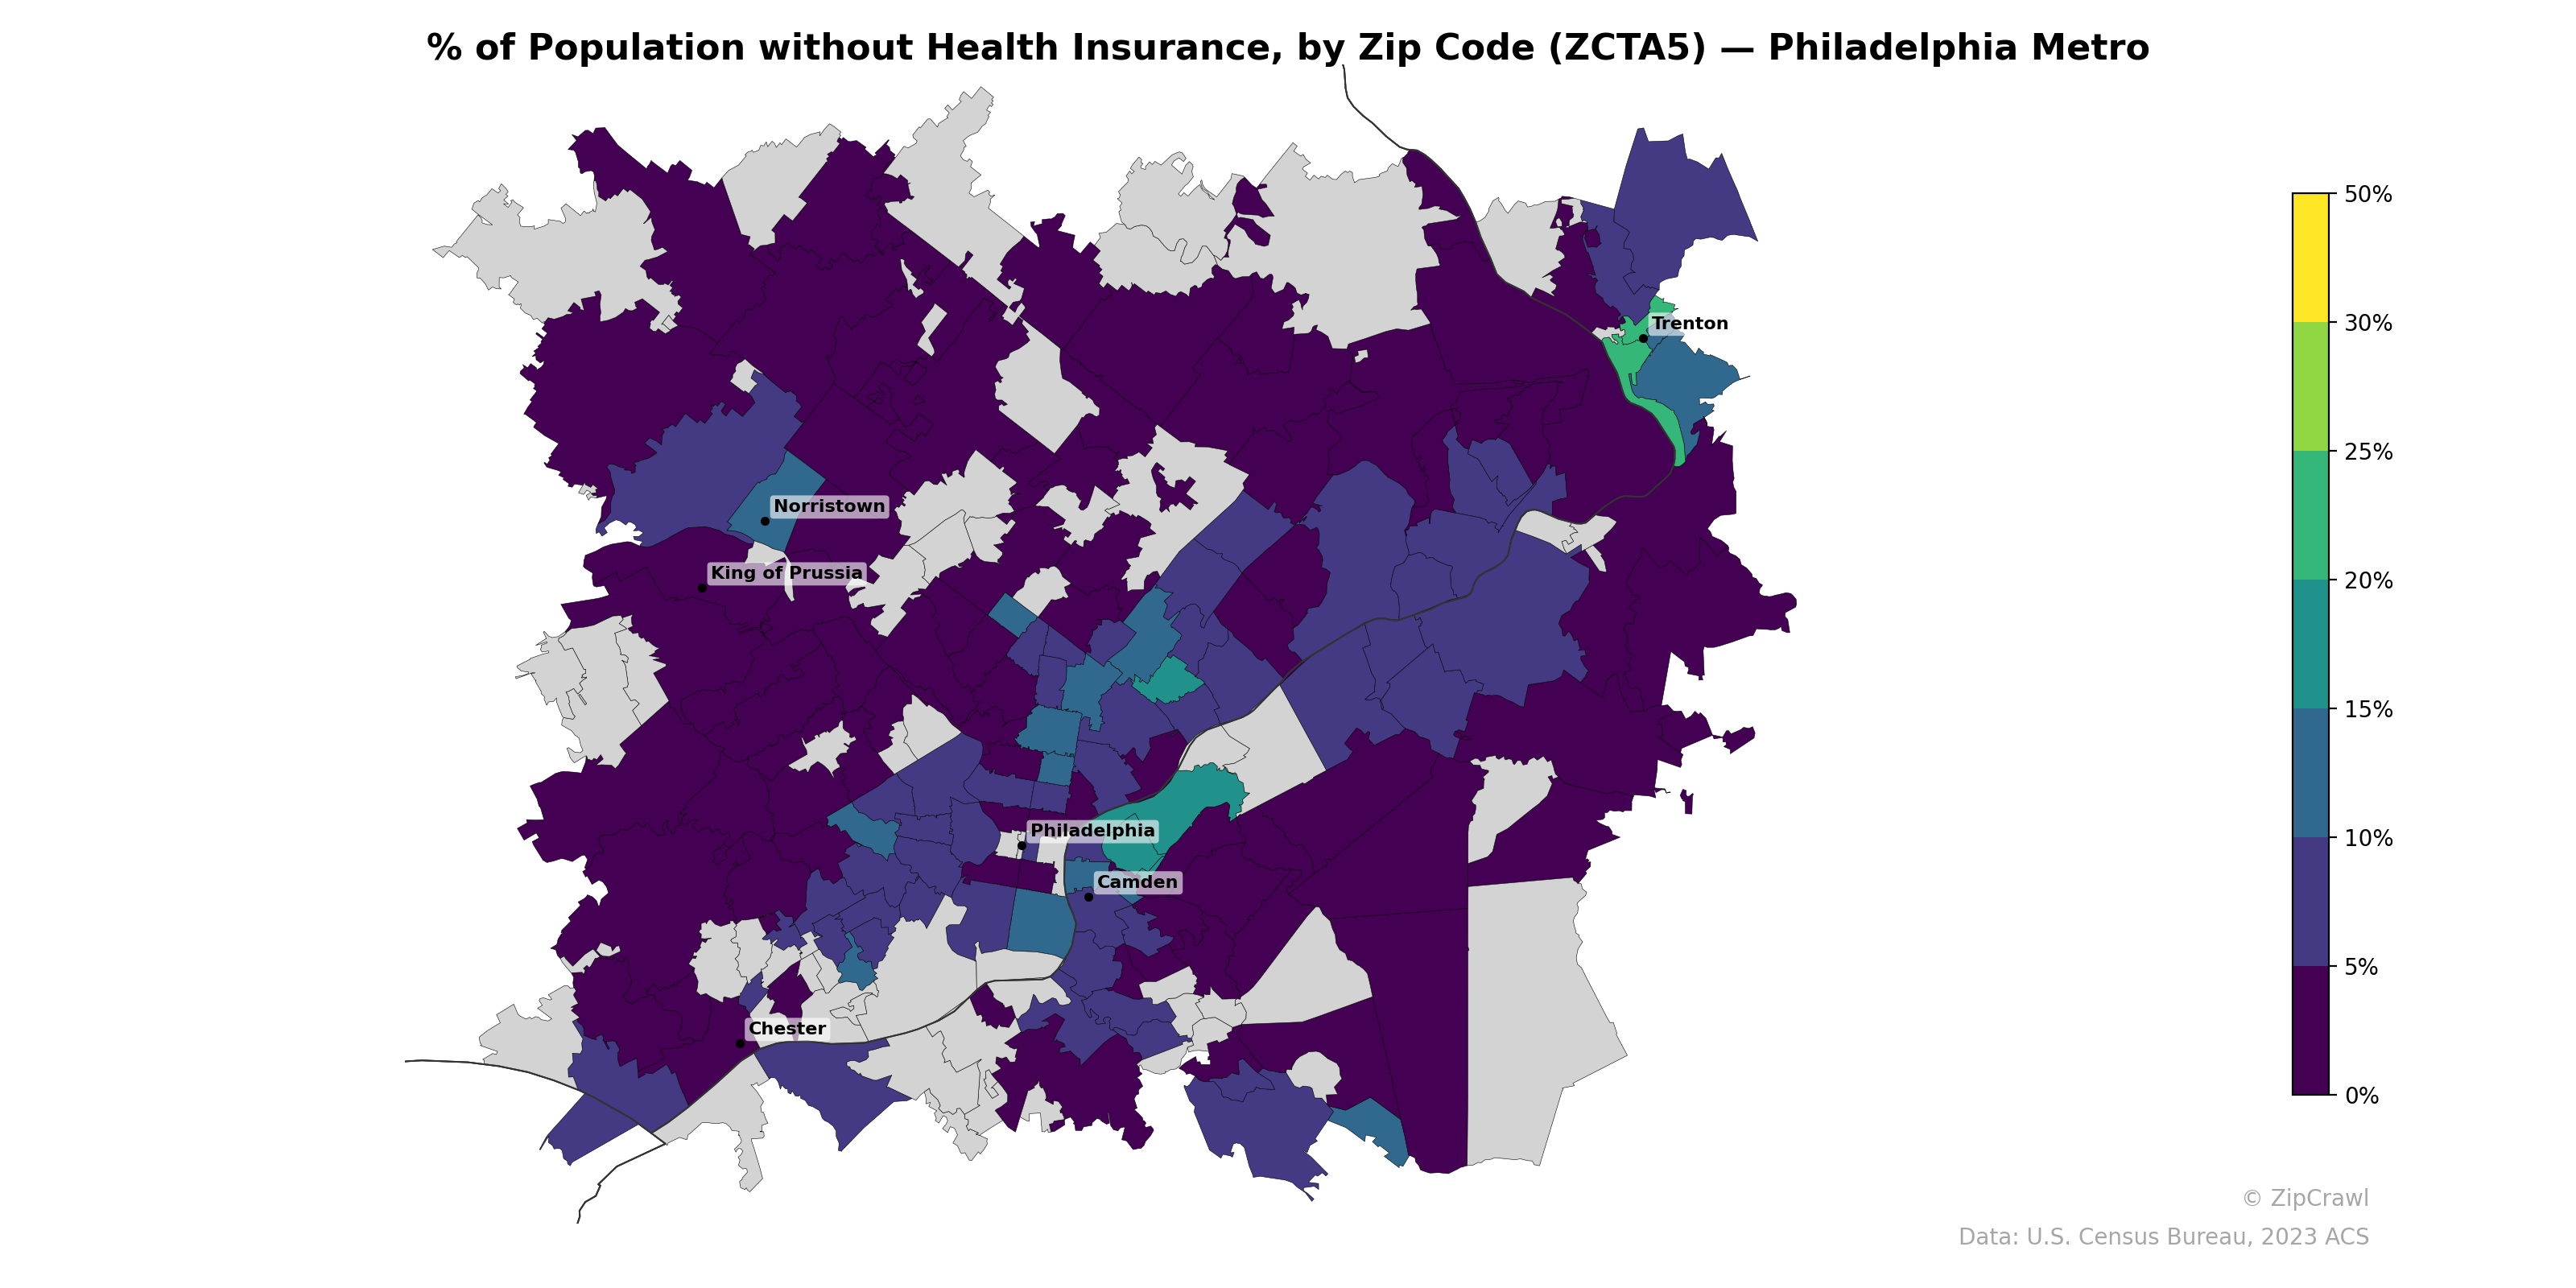
NOTE: Gray indicates insufficient data or a suppressed estimate.
Uninsured rates concentrate most heavily in Philadelphia's core urban zip codes and the Camden area across the Delaware River, where several zip codes reach 15–25% uninsured, with pockets near Trenton also showing elevated rates in the teal-to-green range. Suburban zip codes in Chester, Delaware, and Montgomery counties—particularly around King of Prussia and the western periphery—consistently register among the lowest uninsured rates at under 5%, creating a sharp urban-suburban divide. Norristown stands out as a modest exception to the suburban trend, displaying slightly elevated uninsured percentages relative to its surrounding Montgomery County neighbors.
Data: U.S. Census Bureau, 2023 ACS
Explore
- Housing Vacancy Rate by Zip Code (ZCTA5) — Philadelphia Metro
- Housing Median Monthly Rent ($), by Zip Code (ZCTA5) — Philadelphia Metro
- Married Couple (% of all Households) by Zip Code (ZCTA5) — Philadelphia Metro
- Housing % of Units Built Since 2010, by Zip Code (ZCTA5) — Philadelphia Metro
- % of Households with Broadband Internet, by Zip Code (ZCTA5) — Philadelphia Metro
- Household Average Size by Zip Code (ZCTA5) — Philadelphia Metro
- Housing Owner-Occupied % of Units, by Zip Code (ZCTA5) — Philadelphia Metro
- Housing Owner-Occupied Median Value ($), by Zip Code (ZCTA5) — Philadelphia Metro
- Bachelor's Degree or Higher (% of Over 25) by Zip Code (ZCTA5) — Philadelphia Metro
- Population Non-Hispanic Asian % by Zip Code (ZCTA5) — West Virginia
- Population Hispanic % by County
- Housing Owner-Occupied Median Value ($), by County
- High School Graduate (% of Over 25) by Zip Code (ZCTA5) — Los Angeles Metro
- Population Non-Hispanic White % by Zip Code (ZCTA5) — Los Angeles Metro
- Population Non-Hispanic American Indian % by Zip Code (ZCTA5) — Los Angeles Metro
- Population Non-Hispanic Black % by Zip Code (ZCTA5) — Los Angeles Metro
- % of Population on Food Stamps or SNAP (Last 12 Months), by Zip Code (ZCTA5) — New York Metro
- Median Age by Zip Code (ZCTA5) — Los Angeles Metro
- U.S. Citizens (% of Population Over 18) by Zip Code (ZCTA5) — Los Angeles Metro
- Population Hispanic % by Zip Code (ZCTA5) — Los Angeles Metro
- Household Median Income by Zip Code (ZCTA5) — Los Angeles Metro
- Housing % of Units Built Since 2010, by Zip Code (ZCTA5) — Virginia
- Housing Owner-Occupied Median Value ($), by Zip Code (ZCTA5) — Virginia
- Household Average Size by Zip Code (ZCTA5) — Virginia
- Population Non-Hispanic American Indian % by Zip Code (ZCTA5) — Virginia
- Population Non-Hispanic Black % by Zip Code (ZCTA5) — Virginia
- % of Households with Broadband Internet, by Zip Code (ZCTA5) — Virginia
- Housing Owner-Occupied % of Units, by Zip Code (ZCTA5) — Virginia
- Housing Median Monthly Rent ($), by Zip Code (ZCTA5) — Virginia
- High School Graduate (% of Over 25) by Zip Code (ZCTA5) — Virginia
- % of Population without Health Insurance, by Zip Code (ZCTA5) — Phoenix Metro
- % of Population without Health Insurance, by Zip Code (ZCTA5) — Boston Metro
- % of Population without Health Insurance, by Zip Code (ZCTA5) — Houston Metro
- % of Population without Health Insurance, by Zip Code (ZCTA5) — Miami Metro
- % of Population without Health Insurance, by Zip Code (ZCTA5) — Detroit Metro
- % of Population without Health Insurance, by Zip Code (ZCTA5) — Tampa Metro
- % of Population without Health Insurance, by Zip Code (ZCTA5) — Chicago Metro
- % of Population without Health Insurance, by Zip Code (ZCTA5) — Orlando Metro
- % of Population without Health Insurance, by Zip Code (ZCTA5) — Dallas Metro
- % of Population without Health Insurance, by Zip Code (ZCTA5) — Denver Metro