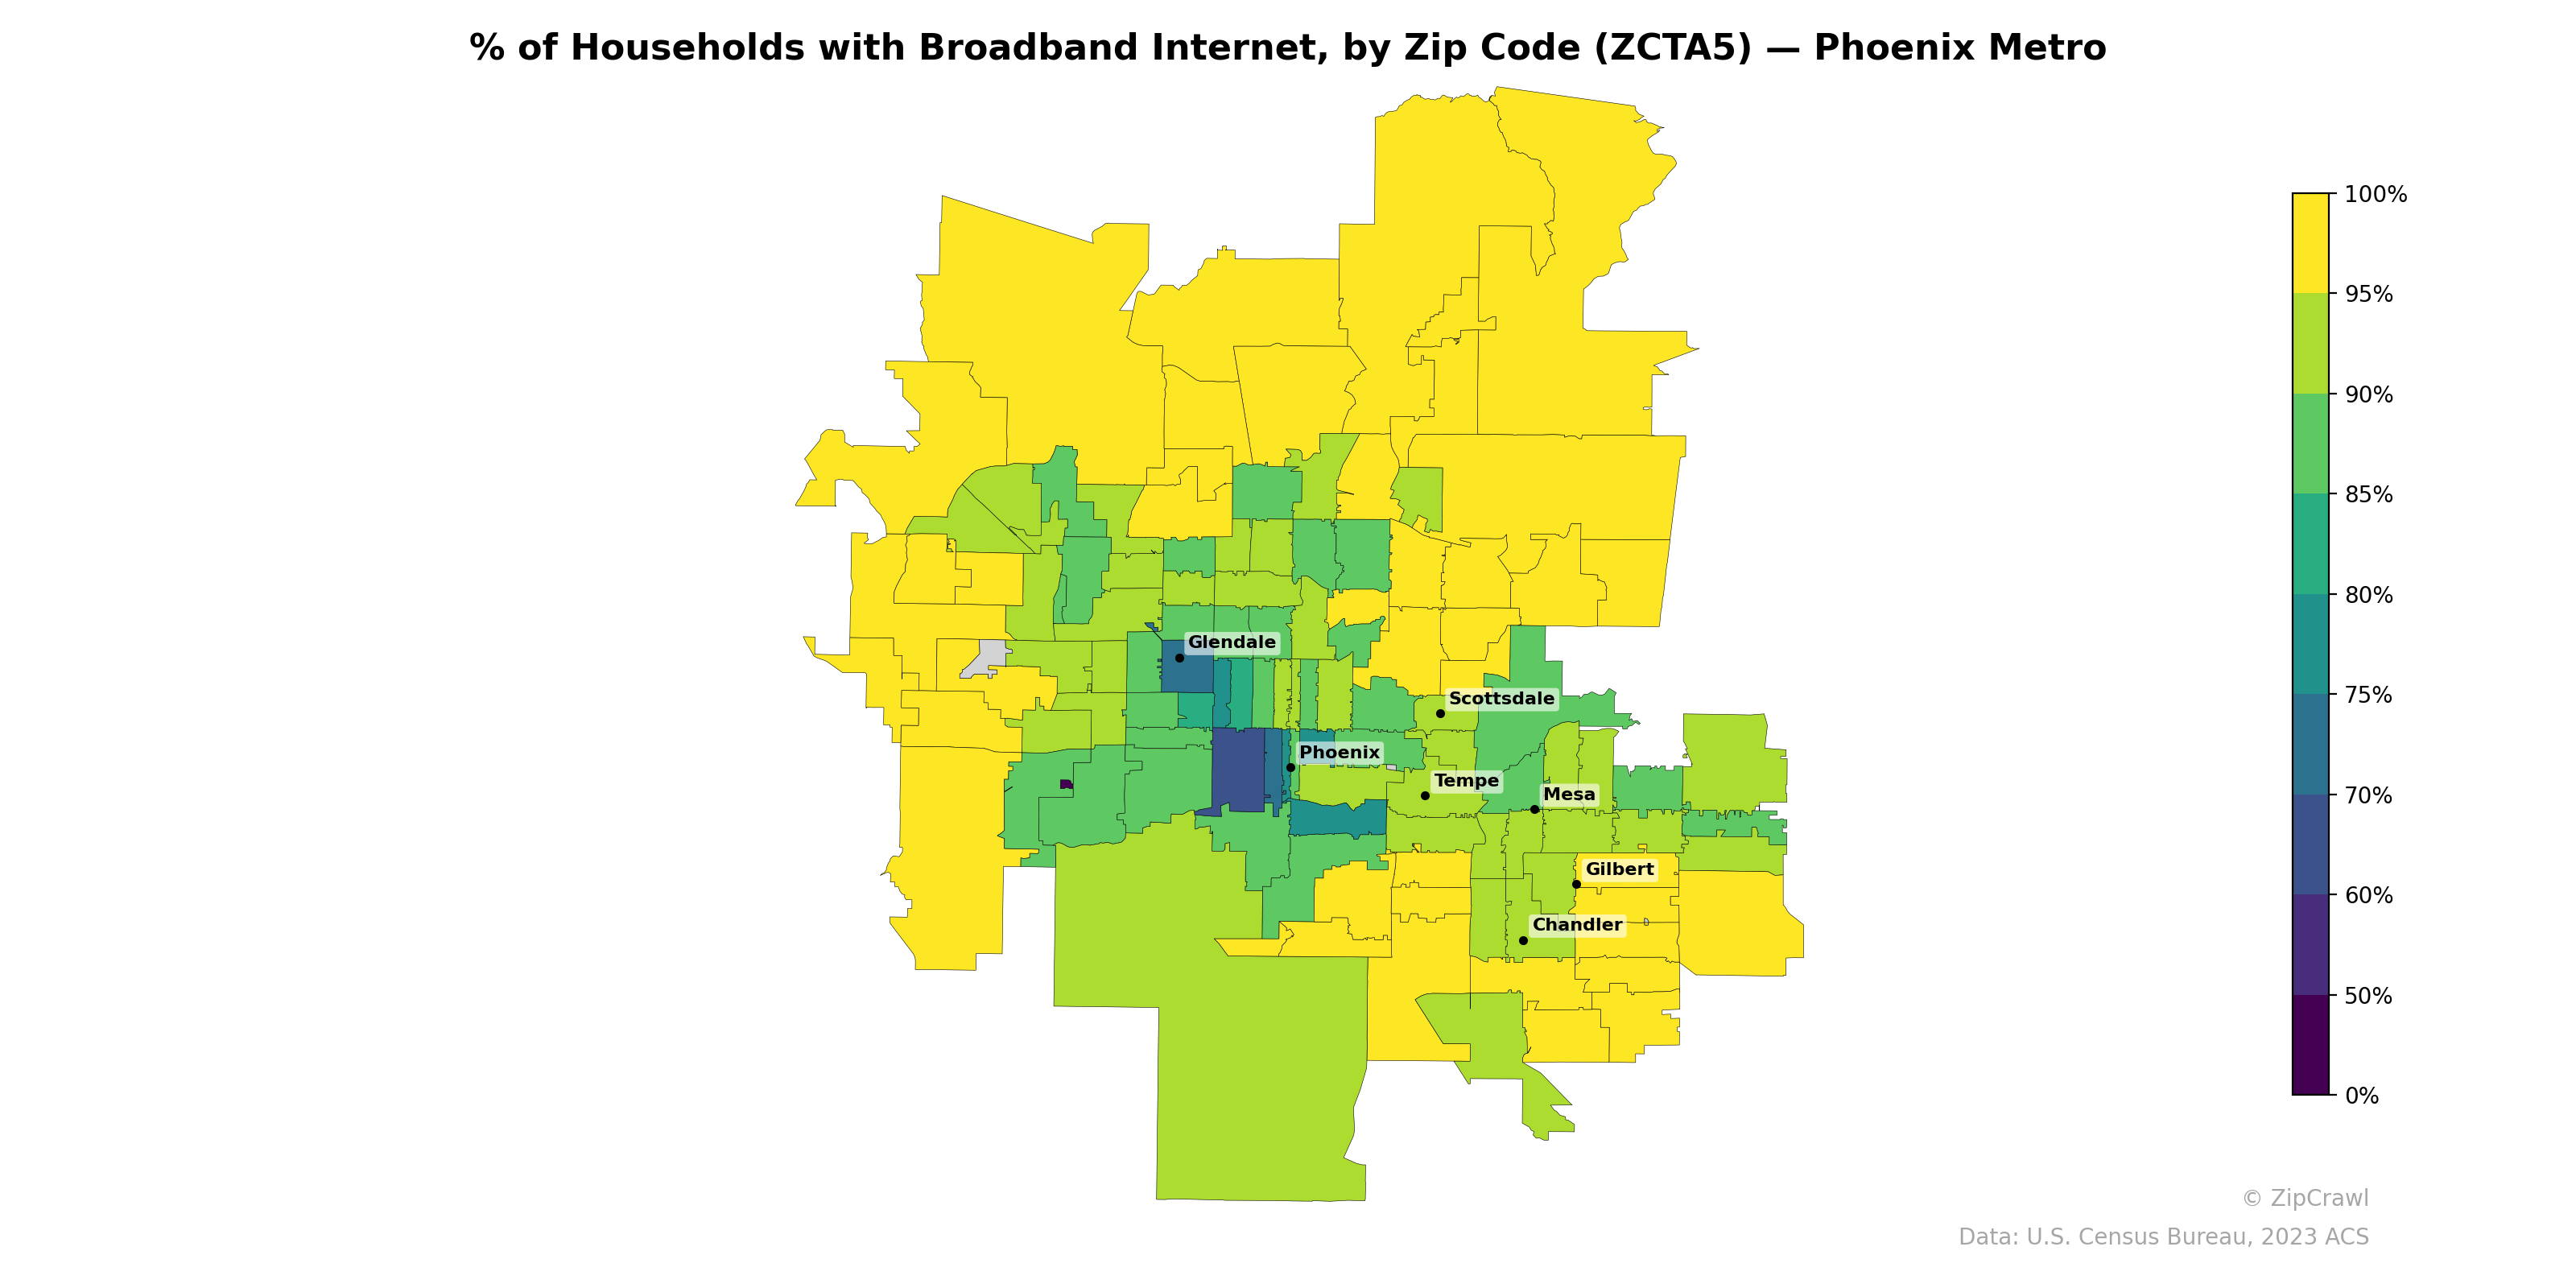
NOTE: Gray indicates insufficient data or a suppressed estimate.
Broadband internet adoption in the Phoenix metro exhibits a clear core-periphery divide, with central Phoenix zip codes—particularly near downtown and south Phoenix—falling below 70%, while outer suburban areas in north Scottsdale, Gilbert, and the far northwest consistently exceed 90%. The lowest-connectivity cluster appears in a band of zip codes running through central and south Phoenix, where rates dip into the 50–65% range, contrasting sharply with adjacent affluent areas like north Scottsdale and northeast Mesa that approach near-universal broadband coverage. Newer master-planned communities on the metro's southern and western fringes generally show strong adoption in the 85–95% range, suggesting that housing age and median income are likely key drivers of this spatial pattern.
Data: U.S. Census Bureau, 2023 ACS
Explore
- Household Median Income by Zip Code (ZCTA5) — Los Angeles Metro
- Household Average Size by Zip Code (ZCTA5) — Phoenix Metro
- Housing Owner-Occupied Median Value ($), by Zip Code (ZCTA5) — Phoenix Metro
- Housing Median Monthly Rent ($), by Zip Code (ZCTA5) — Phoenix Metro
- Housing Owner-Occupied % of Units, by Zip Code (ZCTA5) — Phoenix Metro
- % of Population without Health Insurance, by Zip Code (ZCTA5) — Phoenix Metro
- Housing % of Units Built Since 2010, by Zip Code (ZCTA5) — Phoenix Metro
- Housing Vacancy Rate by Zip Code (ZCTA5) — Phoenix Metro
- Married Couple (% of all Households) by Zip Code (ZCTA5) — Phoenix Metro
- Bachelor's Degree or Higher (% of Over 25) by Zip Code (ZCTA5) — Phoenix Metro
- Housing Vacancy Rate by Zip Code (ZCTA5) — Hawaii
- Population Hispanic % by County
- High School Graduate (% of Over 25) by Zip Code (ZCTA5) — Los Angeles Metro
- Population Non-Hispanic White % by Zip Code (ZCTA5) — Los Angeles Metro
- Population Non-Hispanic American Indian % by Zip Code (ZCTA5) — Los Angeles Metro
- Population Non-Hispanic Black % by Zip Code (ZCTA5) — Los Angeles Metro
- % of Population on Food Stamps or SNAP (Last 12 Months), by Zip Code (ZCTA5) — New York Metro
- Median Age by Zip Code (ZCTA5) — Los Angeles Metro
- U.S. Citizens (% of Population Over 18) by Zip Code (ZCTA5) — Los Angeles Metro
- Population Hispanic % by Zip Code (ZCTA5) — Los Angeles Metro
- Married Couple (% of all Households) by Zip Code (ZCTA5) — Virginia
- Housing % of Units Built Since 2010, by Zip Code (ZCTA5) — Virginia
- Housing Vacancy Rate by Zip Code (ZCTA5) — Virginia
- Bachelor's Degree or Higher (% of Over 25) by Zip Code (ZCTA5) — Virginia
- High School Graduate (% of Over 25) by Zip Code (ZCTA5) — Virginia
- % of Population without Health Insurance, by Zip Code (ZCTA5) — Virginia
- Housing Owner-Occupied Median Value ($), by Zip Code (ZCTA5) — Virginia
- Housing Median Monthly Rent ($), by Zip Code (ZCTA5) — Virginia
- Household Average Size by Zip Code (ZCTA5) — Virginia
- Population Non-Hispanic Black % by Zip Code (ZCTA5) — Virginia
- % of Households with Broadband Internet, by Zip Code (ZCTA5) — Houston Metro
- % of Households with Broadband Internet, by Zip Code (ZCTA5) — Portland Metro
- % of Households with Broadband Internet, by Zip Code (ZCTA5) — Miami Metro
- % of Households with Broadband Internet, by Zip Code (ZCTA5) — Orlando Metro
- % of Households with Broadband Internet, by Zip Code (ZCTA5) — Boston Metro
- % of Households with Broadband Internet, by Zip Code (ZCTA5) — Detroit Metro
- % of Households with Broadband Internet, by Zip Code (ZCTA5) — Tampa Metro
- % of Households with Broadband Internet, by Zip Code (ZCTA5) — Chicago Metro
- % of Households with Broadband Internet, by Zip Code (ZCTA5) — Denver Metro
- % of Households with Broadband Internet, by Zip Code (ZCTA5) — Dallas Metro