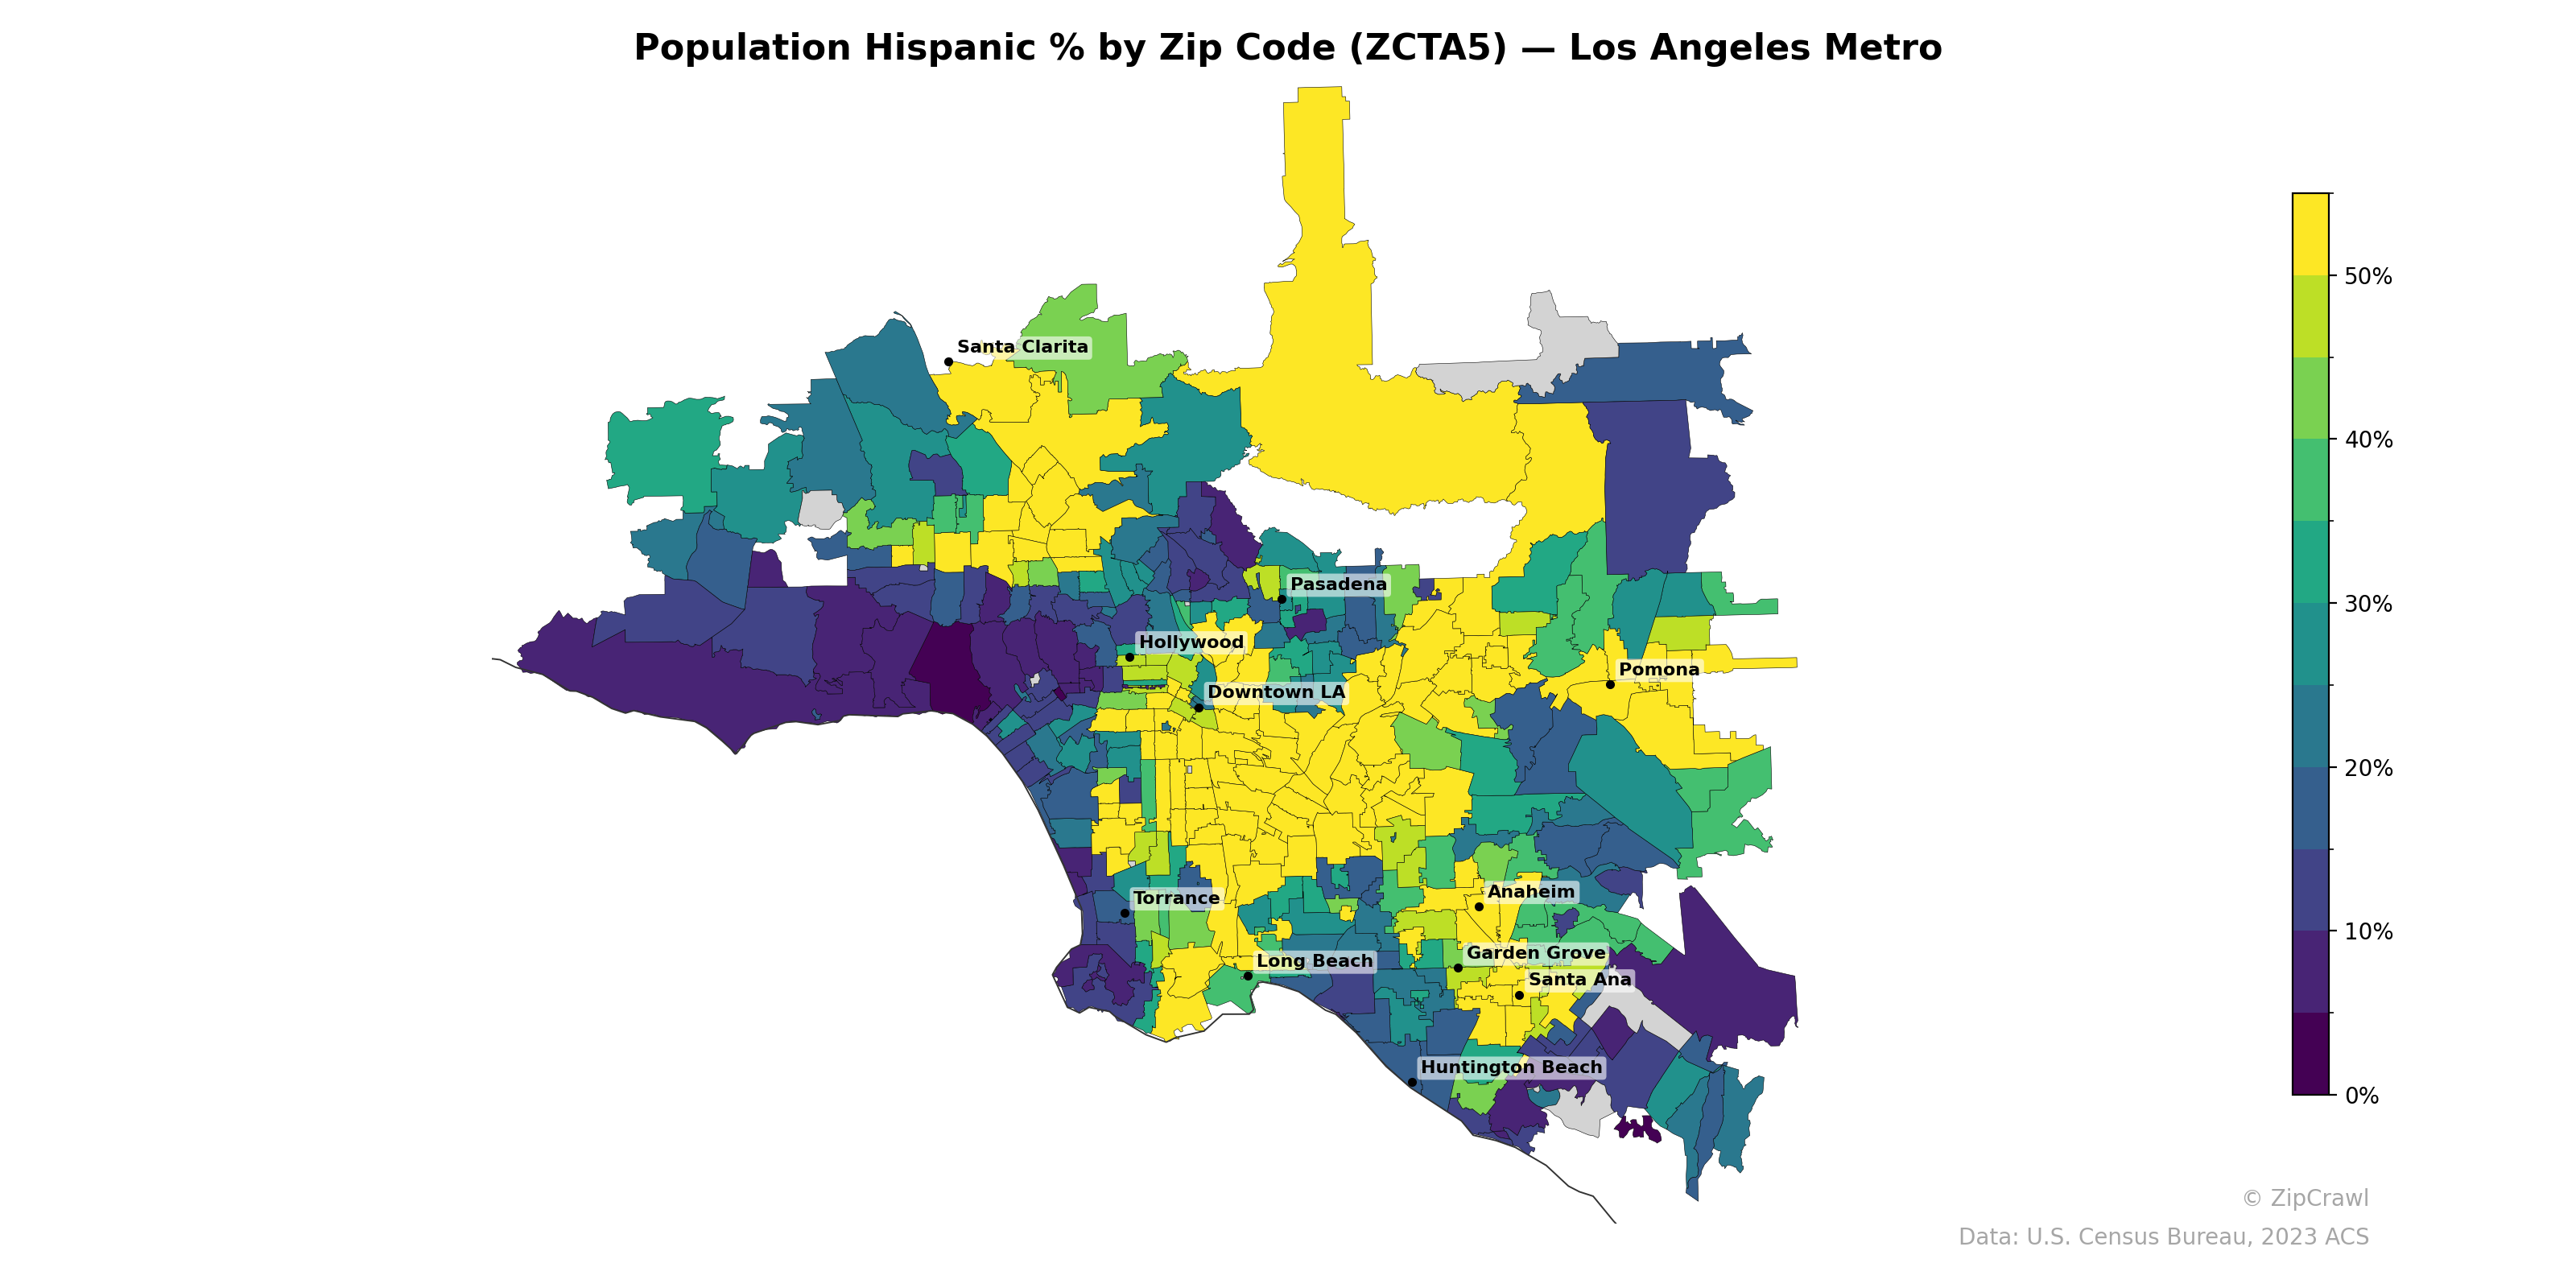
NOTE: Gray indicates insufficient data or a suppressed estimate.
Hispanic population concentration forms a strong east-west gradient across the metro, with the highest shares (exceeding 50%) clustered in the eastern San Gabriel Valley, Pomona, and Santa Ana areas, while the westside coastal communities from Malibu through the Palos Verdes peninsula register among the lowest percentages at under 10-15%. A dense band of majority-Hispanic zip codes extends from Downtown LA southward through South Los Angeles and eastward through the San Gabriel Valley, contrasting sharply with the predominantly non-Hispanic enclaves of the Westside, Hollywood Hills, and the southern Orange County coast near Laguna Beach and San Clemente.
Data: U.S. Census Bureau, 2023 ACS
Explore
- % of Population on Food Stamps or SNAP (Last 12 Months), by Zip Code (ZCTA5) — Virginia
- Population Non-Hispanic American Indian % by Zip Code (ZCTA5) — Washington
- High School Graduate (% of Over 25) by Zip Code (ZCTA5) — Washington
- U.S. Citizens (% of Population Over 18) by Zip Code (ZCTA5) — Washington
- Population Non-Hispanic Black % by Zip Code (ZCTA5) — Washington
- Median Age by Zip Code (ZCTA5) — Washington
- Population Non-Hispanic Asian % by Zip Code (ZCTA5) — Virginia
- Household Median Income by Zip Code (ZCTA5) — Washington
- Population Non-Hispanic White % by Zip Code (ZCTA5) — Washington
- % of Population on Food Stamps or SNAP (Last 12 Months), by Zip Code (ZCTA5) — New York Metro
- High School Graduate (% of Over 25) by Zip Code (ZCTA5) — Los Angeles Metro
- Population Non-Hispanic American Indian % by Zip Code (ZCTA5) — Los Angeles Metro
- Median Age by Zip Code (ZCTA5) — Los Angeles Metro
- Household Median Income by Zip Code (ZCTA5) — Los Angeles Metro
- U.S. Citizens (% of Population Over 18) by Zip Code (ZCTA5) — Los Angeles Metro
- Population Non-Hispanic White % by Zip Code (ZCTA5) — Los Angeles Metro
- Population Non-Hispanic Black % by Zip Code (ZCTA5) — Los Angeles Metro
- Housing Vacancy Rate by Zip Code (ZCTA5) — Virginia
- Housing % of Units Built Since 2010, by Zip Code (ZCTA5) — Virginia
- Married Couple (% of all Households) by Zip Code (ZCTA5) — Virginia
- Housing Owner-Occupied Median Value ($), by Zip Code (ZCTA5) — Virginia
- Bachelor's Degree or Higher (% of Over 25) by Zip Code (ZCTA5) — Virginia
- High School Graduate (% of Over 25) by Zip Code (ZCTA5) — Virginia
- % of Households with Broadband Internet, by Zip Code (ZCTA5) — Virginia
- % of Population without Health Insurance, by Zip Code (ZCTA5) — Virginia
- Housing Owner-Occupied % of Units, by Zip Code (ZCTA5) — Virginia
- Housing Median Monthly Rent ($), by Zip Code (ZCTA5) — Virginia
- Household Average Size by Zip Code (ZCTA5) — Virginia
- Median Age by Zip Code (ZCTA5) — Virginia
- Household Median Income by Zip Code (ZCTA5) — Virginia
- Population Hispanic % by Zip Code (ZCTA5) — St. Louis Metro
- Population Hispanic % by Zip Code (ZCTA5) — Austin Metro
- Population Hispanic % by Zip Code (ZCTA5) — Miami Metro
- Population Hispanic % by Zip Code (ZCTA5) — Boston Metro
- Population Hispanic % by Zip Code (ZCTA5) — Atlanta Metro
- Population Hispanic % by Zip Code (ZCTA5) — Tampa Metro
- Population Hispanic % by Zip Code (ZCTA5) — Houston Metro
- Population Hispanic % by Zip Code (ZCTA5) — Detroit Metro
- Population Hispanic % by Zip Code (ZCTA5) — Chicago Metro
- Population Hispanic % by Zip Code (ZCTA5) — Denver Metro