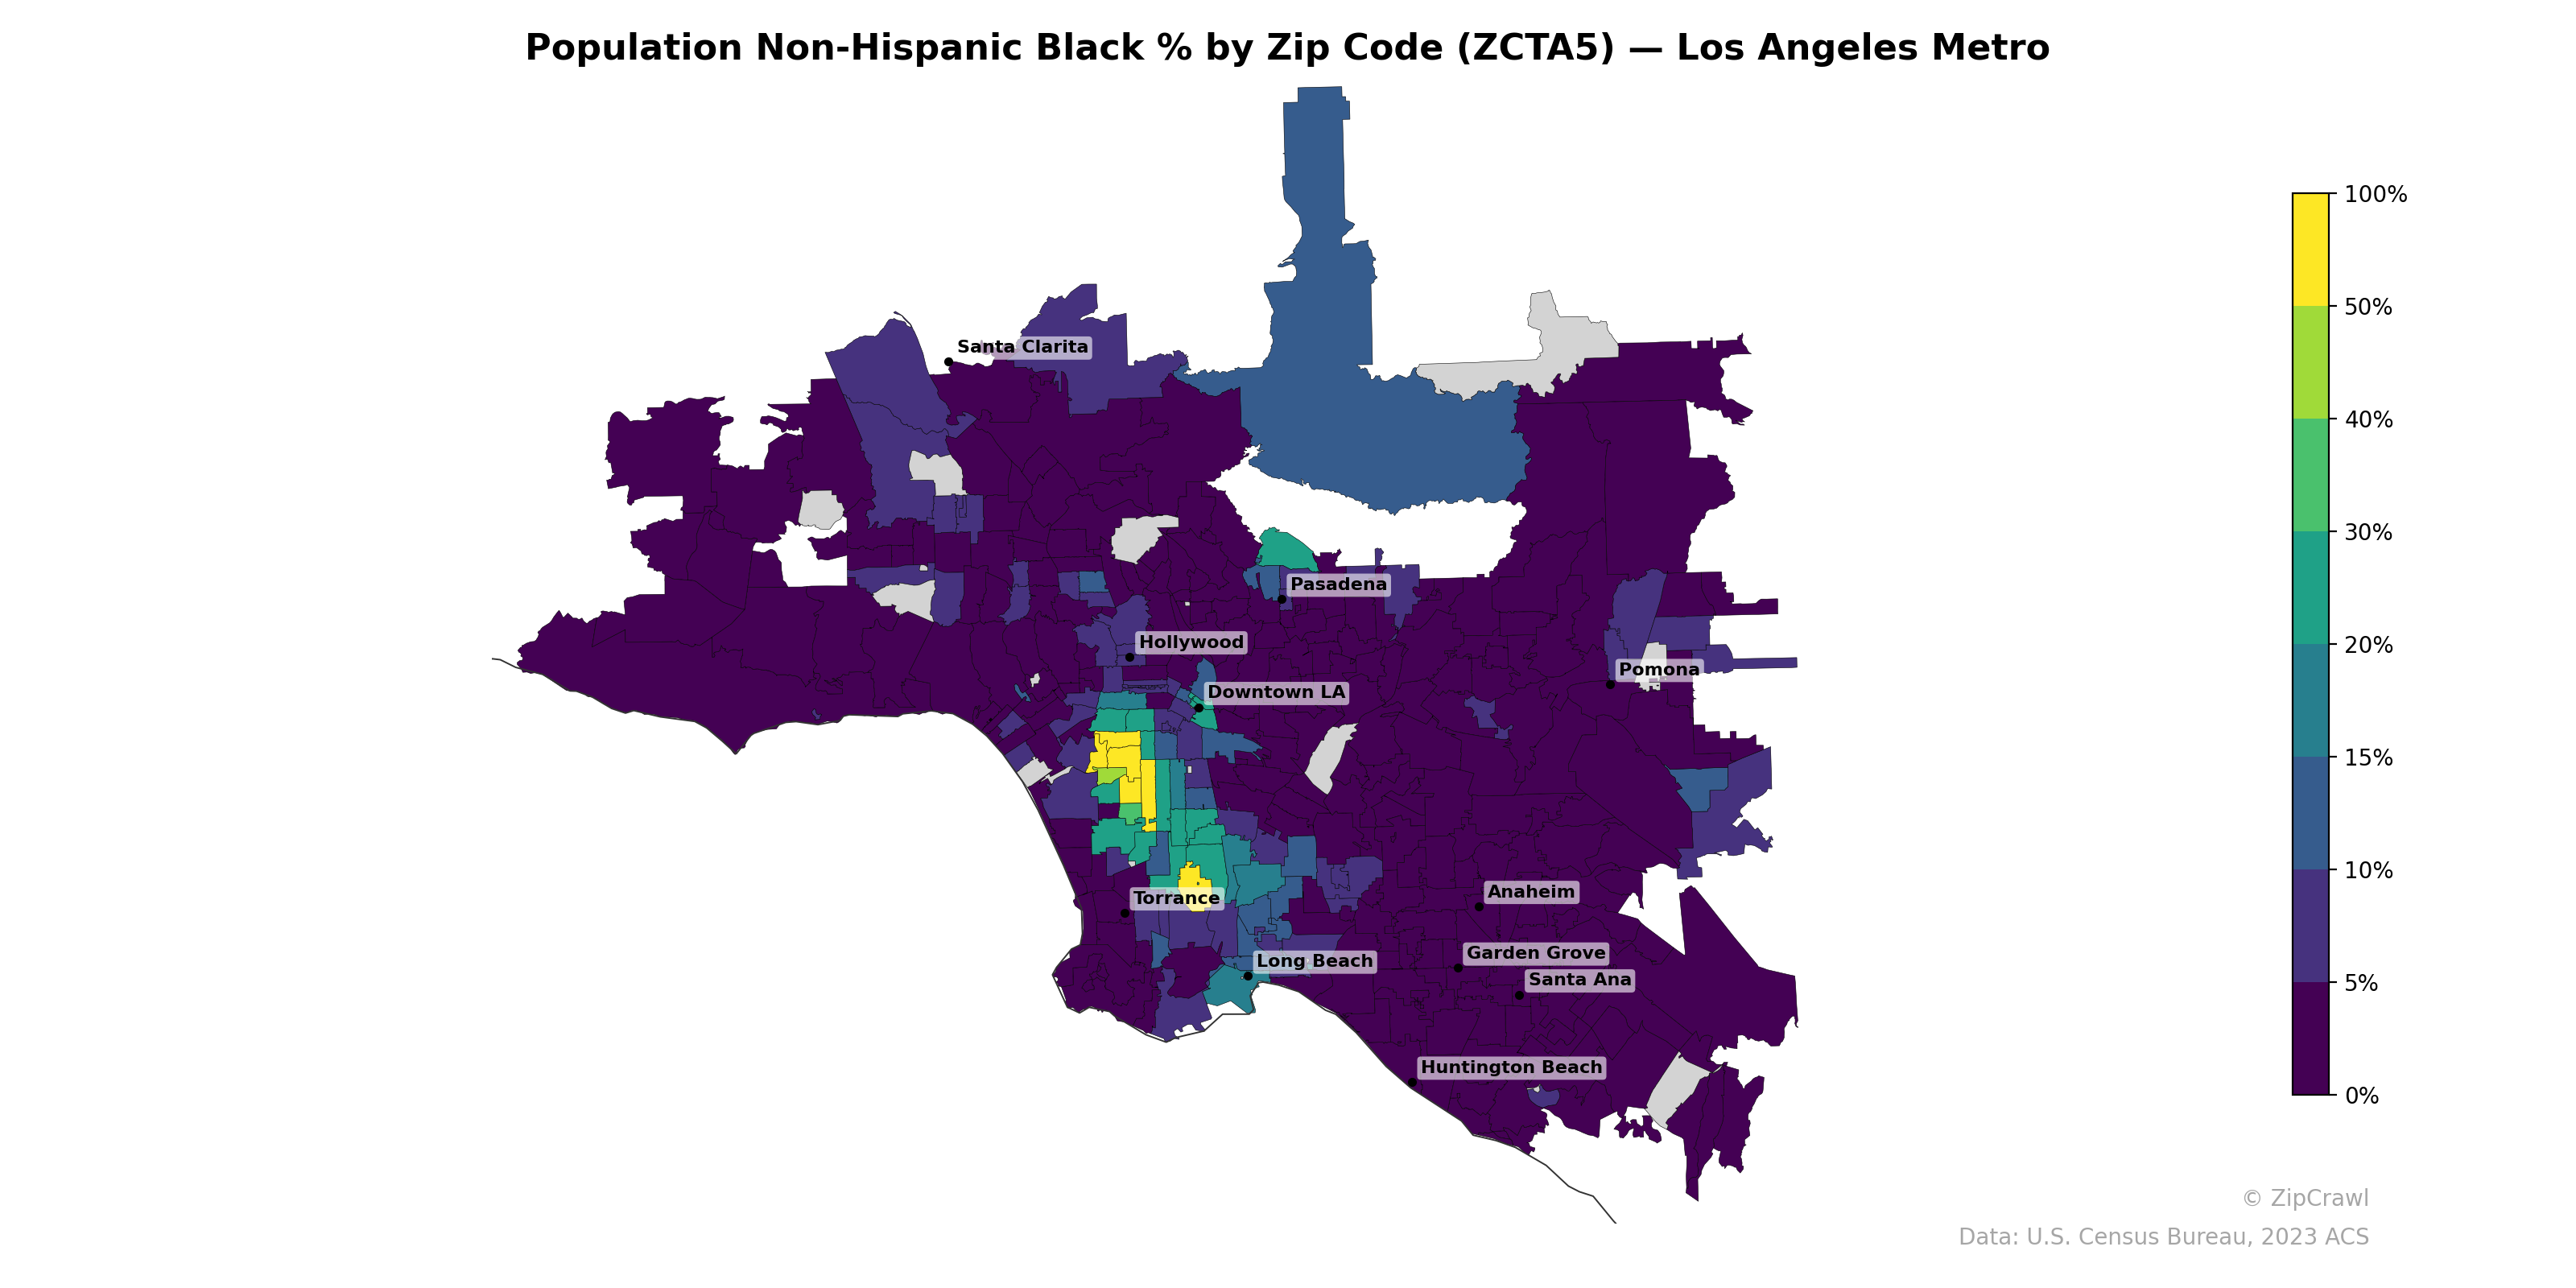
NOTE: Gray indicates insufficient data or a suppressed estimate.
The highest concentrations of non-Hispanic Black residents, exceeding 40-50%, cluster tightly in South Los Angeles zip codes between Downtown LA and Torrance, corresponding to historically Black neighborhoods such as Inglewood, Compton, and Willowbrook. A secondary but notably lower concentration appears in the Altadena/northwest Pasadena area and parts of Long Beach, where percentages reach roughly 15-30%. The vast majority of the metro area—including the San Fernando Valley, Orange County, the San Gabriel Valley, and coastal communities—registers below 5%, underscoring the sharp spatial segregation of the Black population into a relatively compact corridor south of downtown.
Data: U.S. Census Bureau, 2023 ACS
Explore
- Married Couple (% of all Households) by Zip Code (ZCTA5) — Washington
- Housing Vacancy Rate by Zip Code (ZCTA5) — Washington
- Housing % of Units Built Since 2010, by Zip Code (ZCTA5) — Washington
- % of Population without Health Insurance, by Zip Code (ZCTA5) — Washington
- Household Average Size by Zip Code (ZCTA5) — Washington
- % of Households with Broadband Internet, by Zip Code (ZCTA5) — Washington
- Housing Median Monthly Rent ($), by Zip Code (ZCTA5) — Washington
- Bachelor's Degree or Higher (% of Over 25) by Zip Code (ZCTA5) — Washington
- Housing Owner-Occupied Median Value ($), by Zip Code (ZCTA5) — Washington
- Housing Owner-Occupied % of Units, by Zip Code (ZCTA5) — Washington
- Population Hispanic % by County
- Population Non-Hispanic American Indian % by Zip Code (ZCTA5) — Los Angeles Metro
- Population Hispanic % by Zip Code (ZCTA5) — Los Angeles Metro
- High School Graduate (% of Over 25) by Zip Code (ZCTA5) — Los Angeles Metro
- Median Age by Zip Code (ZCTA5) — Los Angeles Metro
- U.S. Citizens (% of Population Over 18) by Zip Code (ZCTA5) — Los Angeles Metro
- Household Median Income by Zip Code (ZCTA5) — Los Angeles Metro
- % of Population on Food Stamps or SNAP (Last 12 Months), by Zip Code (ZCTA5) — New York Metro
- Population Non-Hispanic White % by Zip Code (ZCTA5) — Los Angeles Metro
- Housing Vacancy Rate by Zip Code (ZCTA5) — Virginia
- Household Average Size by Zip Code (ZCTA5) — Virginia
- Population Non-Hispanic Asian % by Zip Code (ZCTA5) — Virginia
- % of Households with Broadband Internet, by Zip Code (ZCTA5) — Virginia
- Housing Owner-Occupied % of Units, by Zip Code (ZCTA5) — Virginia
- High School Graduate (% of Over 25) by Zip Code (ZCTA5) — Virginia
- % of Population without Health Insurance, by Zip Code (ZCTA5) — Virginia
- Housing Median Monthly Rent ($), by Zip Code (ZCTA5) — Virginia
- Housing % of Units Built Since 2010, by Zip Code (ZCTA5) — Virginia
- Married Couple (% of all Households) by Zip Code (ZCTA5) — Virginia
- Population Non-Hispanic American Indian % by Zip Code (ZCTA5) — Virginia
- Population Non-Hispanic Black % by Zip Code (ZCTA5) — St. Louis Metro
- Population Non-Hispanic Black % by Zip Code (ZCTA5) — Austin Metro
- Population Non-Hispanic Black % by Zip Code (ZCTA5) — Boston Metro
- Population Non-Hispanic Black % by Zip Code (ZCTA5) — Miami Metro
- Population Non-Hispanic Black % by Zip Code (ZCTA5) — Atlanta Metro
- Population Non-Hispanic Black % by Zip Code (ZCTA5) — Houston Metro
- Population Non-Hispanic Black % by Zip Code (ZCTA5) — Tampa Metro
- Population Non-Hispanic Black % by Zip Code (ZCTA5) — Detroit Metro
- Population Non-Hispanic Black % by Zip Code (ZCTA5) — Chicago Metro
- Population Non-Hispanic Black % by Zip Code (ZCTA5) — Denver Metro