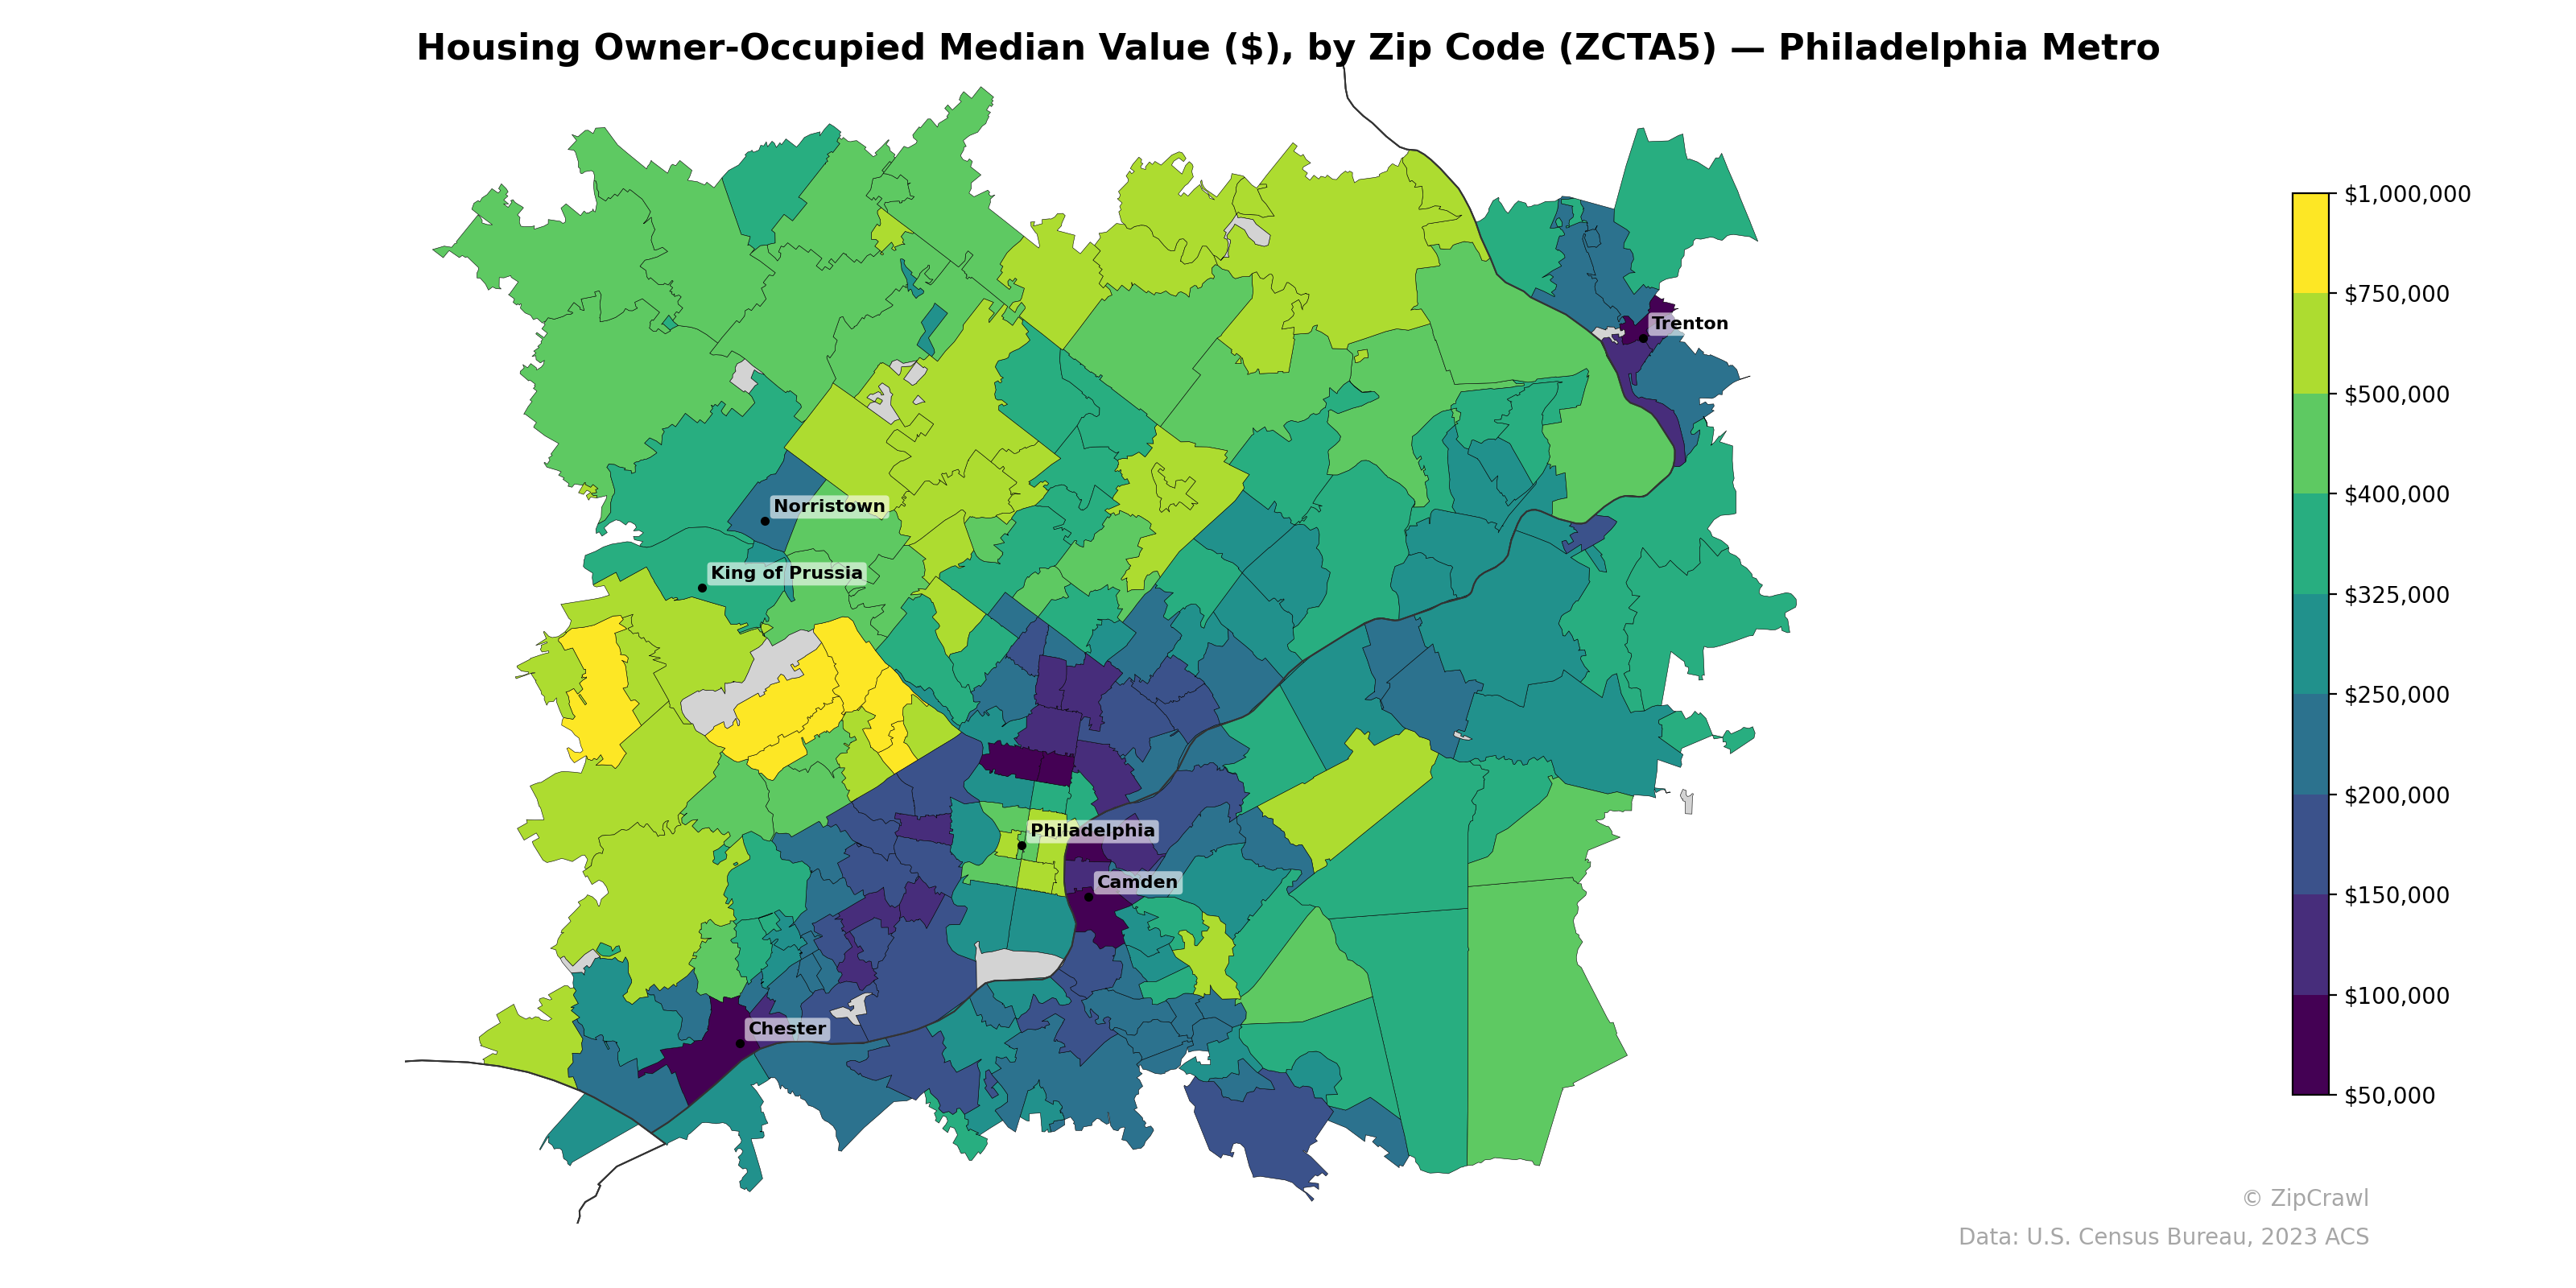
NOTE: Gray indicates insufficient data or a suppressed estimate.
Median owner-occupied housing values in the Philadelphia metro exhibit a strong suburban premium, with the highest concentrations—exceeding $500,000 and reaching toward $1,000,000—clustered in the western and northwestern suburbs spanning Chester and Delaware counties, particularly in the corridor west of King of Prussia. Central Philadelphia and Camden display markedly lower median values, often below $150,000, forming a distinct urban core of depressed housing wealth that contrasts sharply with the surrounding ring suburbs. Trenton similarly registers as a low-value pocket in the northeast, while zip codes in Bucks County and parts of Montgomery County occupy a middle tier ranging roughly from $250,000 to $400,000.
Data: U.S. Census Bureau, 2023 ACS
Explore
- Married Couple (% of all Households) by Zip Code (ZCTA5) — Philadelphia Metro
- Housing Median Monthly Rent ($), by Zip Code (ZCTA5) — Philadelphia Metro
- Housing Vacancy Rate by Zip Code (ZCTA5) — Philadelphia Metro
- Household Average Size by Zip Code (ZCTA5) — Philadelphia Metro
- % of Households with Broadband Internet, by Zip Code (ZCTA5) — Philadelphia Metro
- Housing % of Units Built Since 2010, by Zip Code (ZCTA5) — Philadelphia Metro
- % of Population without Health Insurance, by Zip Code (ZCTA5) — Philadelphia Metro
- Housing Owner-Occupied % of Units, by Zip Code (ZCTA5) — Philadelphia Metro
- Bachelor's Degree or Higher (% of Over 25) by Zip Code (ZCTA5) — Philadelphia Metro
- U.S. Citizens (% of Population Over 18) by Zip Code (ZCTA5) — Hawaii
- Population Hispanic % by County
- U.S. Citizens by County (% of Population Over 18)
- High School Graduate (% of Over 25) by Zip Code (ZCTA5) — Los Angeles Metro
- Population Non-Hispanic White % by Zip Code (ZCTA5) — Los Angeles Metro
- Population Non-Hispanic American Indian % by Zip Code (ZCTA5) — Los Angeles Metro
- Population Non-Hispanic Black % by Zip Code (ZCTA5) — Los Angeles Metro
- % of Population on Food Stamps or SNAP (Last 12 Months), by Zip Code (ZCTA5) — New York Metro
- Median Age by Zip Code (ZCTA5) — Los Angeles Metro
- U.S. Citizens (% of Population Over 18) by Zip Code (ZCTA5) — Los Angeles Metro
- Population Hispanic % by Zip Code (ZCTA5) — Los Angeles Metro
- Household Median Income by Zip Code (ZCTA5) — Los Angeles Metro
- Housing Median Monthly Rent ($), by Zip Code (ZCTA5) — Virginia
- % of Population without Health Insurance, by Zip Code (ZCTA5) — Virginia
- Housing % of Units Built Since 2010, by Zip Code (ZCTA5) — Virginia
- Population Non-Hispanic Black % by Zip Code (ZCTA5) — Virginia
- Population Non-Hispanic American Indian % by Zip Code (ZCTA5) — Virginia
- Bachelor's Degree or Higher (% of Over 25) by Zip Code (ZCTA5) — Virginia
- % of Households with Broadband Internet, by Zip Code (ZCTA5) — Virginia
- Housing Owner-Occupied % of Units, by Zip Code (ZCTA5) — Virginia
- Population Non-Hispanic White % by Zip Code (ZCTA5) — Virginia
- Housing Owner-Occupied Median Value ($), by Zip Code (ZCTA5) — Phoenix Metro
- Housing Owner-Occupied Median Value ($), by Zip Code (ZCTA5) — Houston Metro
- Housing Owner-Occupied Median Value ($), by Zip Code (ZCTA5) — Miami Metro
- Housing Owner-Occupied Median Value ($), by Zip Code (ZCTA5) — Tampa Metro
- Housing Owner-Occupied Median Value ($), by Zip Code (ZCTA5) — Boston Metro
- Housing Owner-Occupied Median Value ($), by Zip Code (ZCTA5) — Detroit Metro
- Housing Owner-Occupied Median Value ($), by Zip Code (ZCTA5) — Denver Metro
- Housing Owner-Occupied Median Value ($), by Zip Code (ZCTA5) — Portland Metro
- Housing Owner-Occupied Median Value ($), by Zip Code (ZCTA5) — Dallas Metro
- Housing Owner-Occupied Median Value ($), by Zip Code (ZCTA5) — Chicago Metro