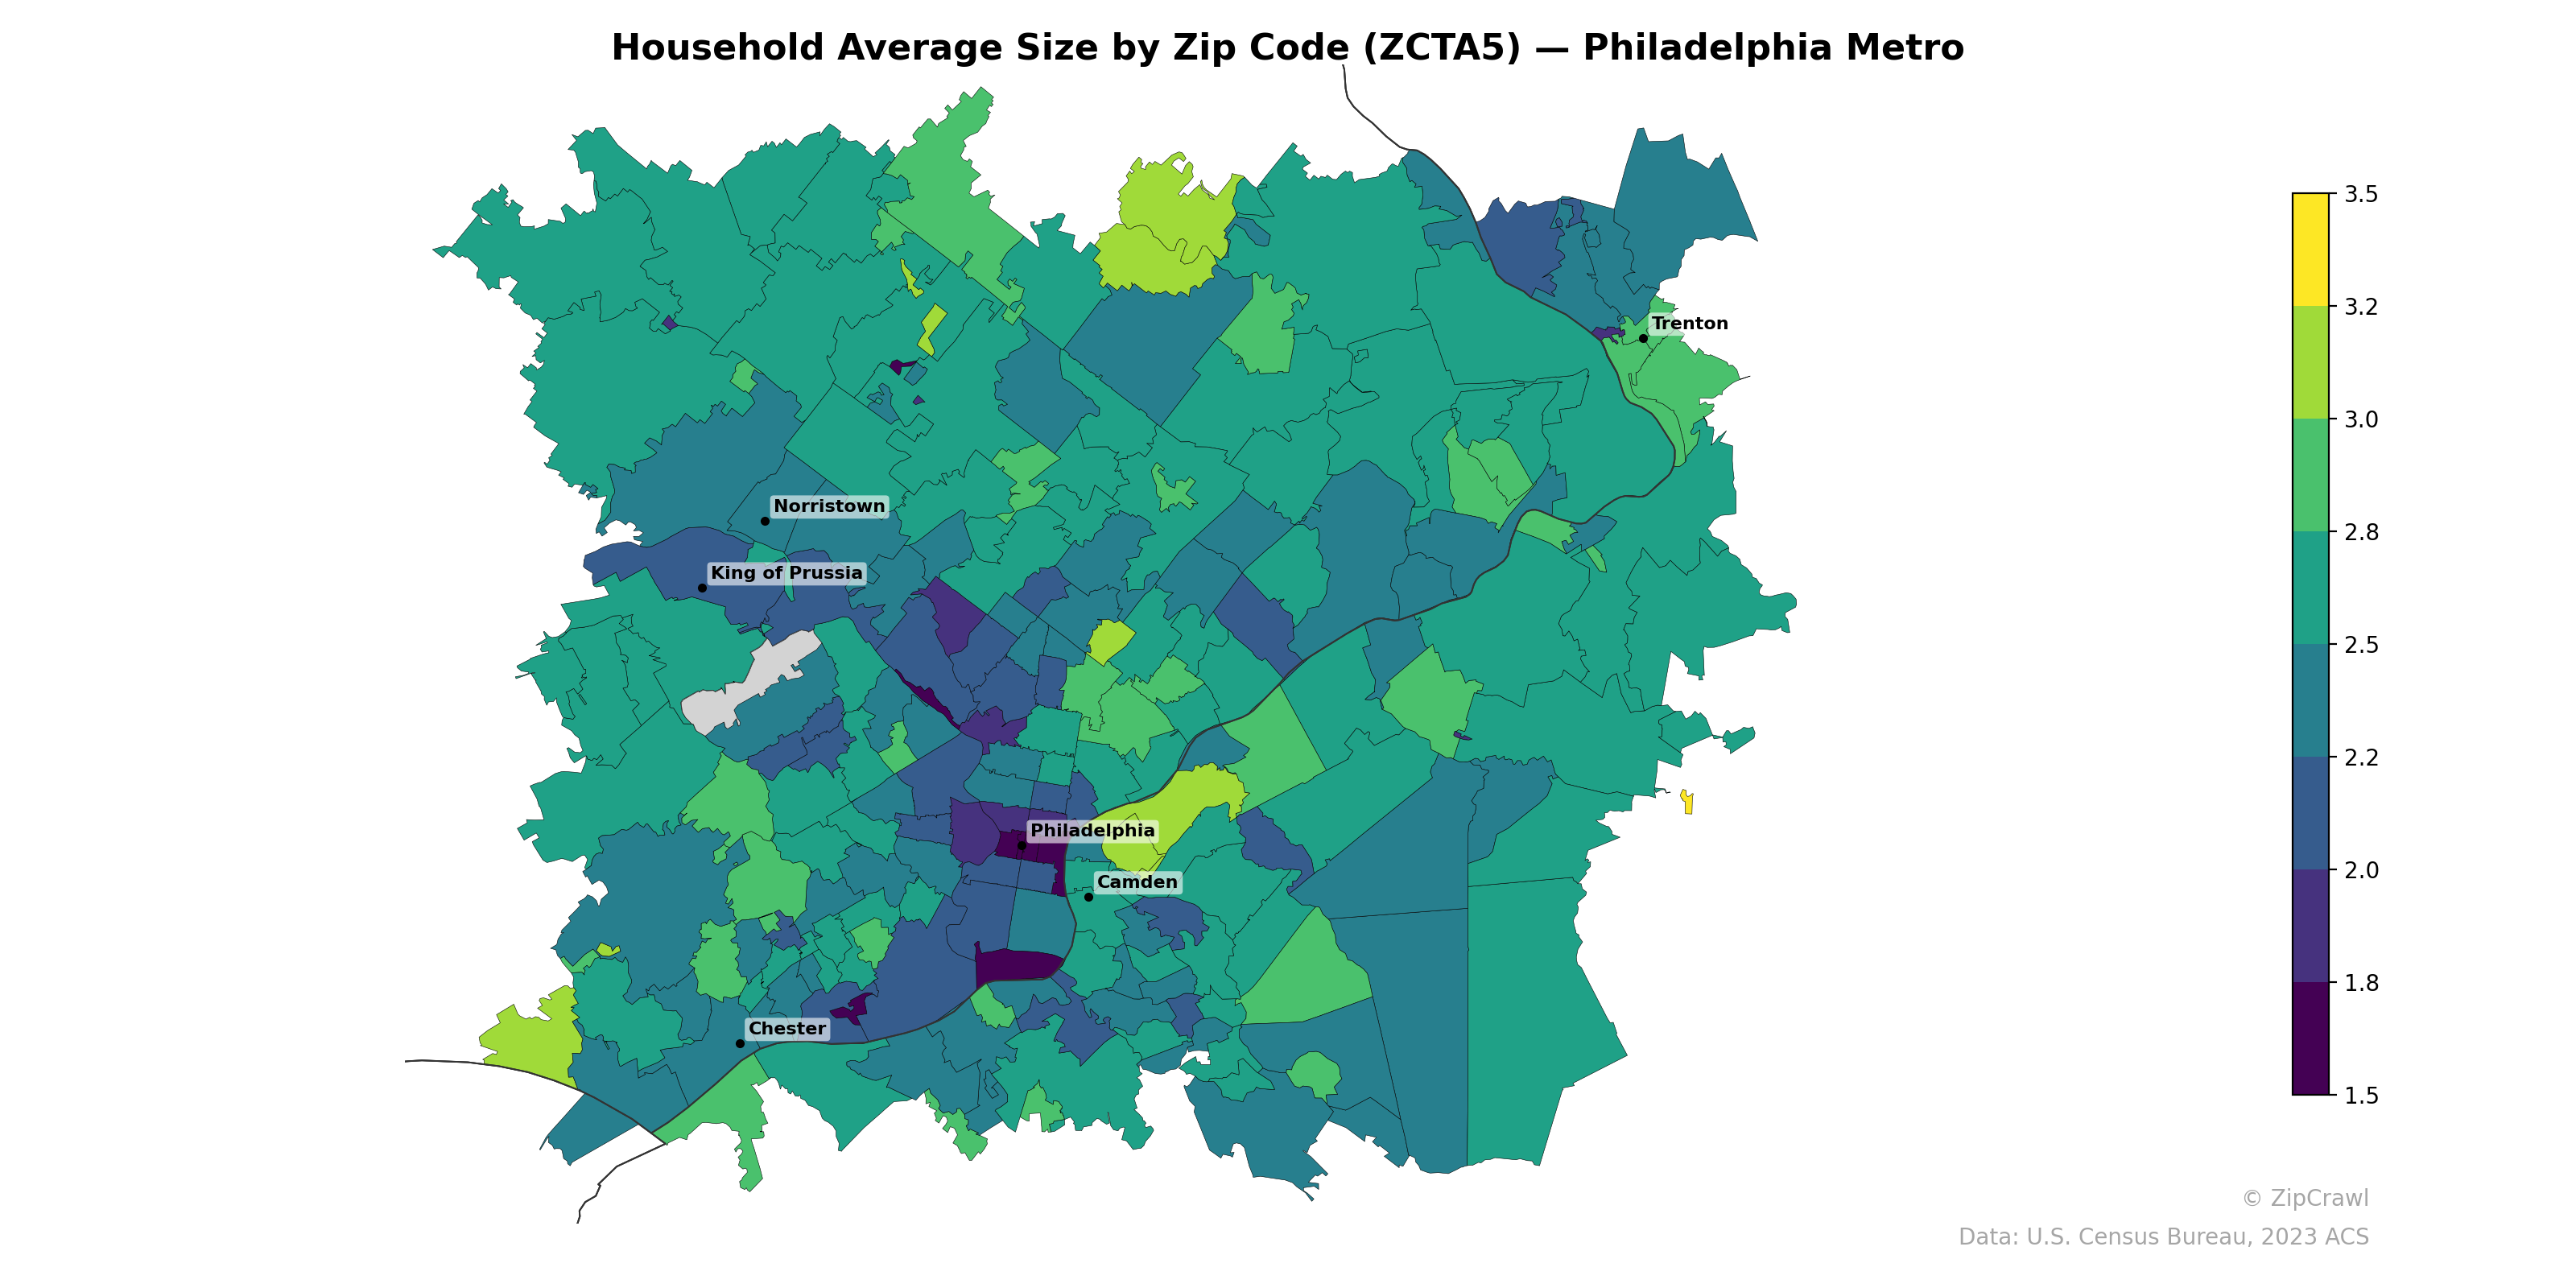
NOTE: Gray indicates insufficient data or a suppressed estimate.
Household sizes in the Philadelphia metro skew smallest in the urban core, with zip codes in Center City and surrounding North Philadelphia neighborhoods dipping below 2.0 persons per household, consistent with high concentrations of single-occupant apartments and student housing. The largest households—averaging 3.0 to 3.5+ persons—cluster in the outer suburban and exurban ring, particularly in the northern reaches of Bucks County and scattered pockets of southern Chester and Delaware counties. A notable contrast exists between the King of Prussia/Norristown corridor, which trends toward moderate sizes around 2.4–2.6, and the immediately adjacent western suburbs where values climb above 2.8, suggesting distinct housing stock and demographic composition within a short geographic span.
Data: U.S. Census Bureau, 2023 ACS
Explore
- Housing % of Units Built Since 2010, by Zip Code (ZCTA5) — Philadelphia Metro
- Housing Owner-Occupied % of Units, by Zip Code (ZCTA5) — Philadelphia Metro
- Married Couple (% of all Households) by Zip Code (ZCTA5) — Philadelphia Metro
- Housing Median Monthly Rent ($), by Zip Code (ZCTA5) — Philadelphia Metro
- Housing Vacancy Rate by Zip Code (ZCTA5) — Philadelphia Metro
- Housing Owner-Occupied Median Value ($), by Zip Code (ZCTA5) — Philadelphia Metro
- % of Households with Broadband Internet, by Zip Code (ZCTA5) — Philadelphia Metro
- % of Population without Health Insurance, by Zip Code (ZCTA5) — Philadelphia Metro
- Bachelor's Degree or Higher (% of Over 25) by Zip Code (ZCTA5) — Philadelphia Metro
- Population Non-Hispanic White % by Zip Code (ZCTA5) — Hawaii
- Population Hispanic % by County
- High School Graduate (% of Over 25) by Zip Code (ZCTA5) — Los Angeles Metro
- Population Non-Hispanic American Indian % by Zip Code (ZCTA5) — Los Angeles Metro
- Median Age by Zip Code (ZCTA5) — Los Angeles Metro
- Population Hispanic % by Zip Code (ZCTA5) — Los Angeles Metro
- Population Non-Hispanic Black % by Zip Code (ZCTA5) — Los Angeles Metro
- Household Median Income by Zip Code (ZCTA5) — Los Angeles Metro
- % of Population on Food Stamps or SNAP (Last 12 Months), by Zip Code (ZCTA5) — New York Metro
- Population Non-Hispanic Asian % by County
- Population Non-Hispanic White % by Zip Code (ZCTA5) — Los Angeles Metro
- U.S. Citizens (% of Population Over 18) by Zip Code (ZCTA5) — Los Angeles Metro
- Housing Owner-Occupied Median Value ($), by Zip Code (ZCTA5) — Virginia
- % of Population without Health Insurance, by Zip Code (ZCTA5) — Virginia
- Housing Median Monthly Rent ($), by Zip Code (ZCTA5) — Virginia
- Population Non-Hispanic Black % by Zip Code (ZCTA5) — Virginia
- Population Hispanic % by Zip Code (ZCTA5) — Virginia
- Bachelor's Degree or Higher (% of Over 25) by Zip Code (ZCTA5) — Virginia
- % of Households with Broadband Internet, by Zip Code (ZCTA5) — Virginia
- Housing Owner-Occupied % of Units, by Zip Code (ZCTA5) — Virginia
- Population Non-Hispanic American Indian % by Zip Code (ZCTA5) — Virginia
- Household Average Size by Zip Code (ZCTA5) — Phoenix Metro
- Household Average Size by Zip Code (ZCTA5) — Houston Metro
- Household Average Size by Zip Code (ZCTA5) — Miami Metro
- Household Average Size by Zip Code (ZCTA5) — Detroit Metro
- Household Average Size by Zip Code (ZCTA5) — Boston Metro
- Household Average Size by Zip Code (ZCTA5) — Austin Metro
- Household Average Size by Zip Code (ZCTA5) — Denver Metro
- Household Average Size by Zip Code (ZCTA5) — Tampa Metro
- Household Average Size by Zip Code (ZCTA5) — Portland Metro
- Household Average Size by Zip Code (ZCTA5) — Chicago Metro