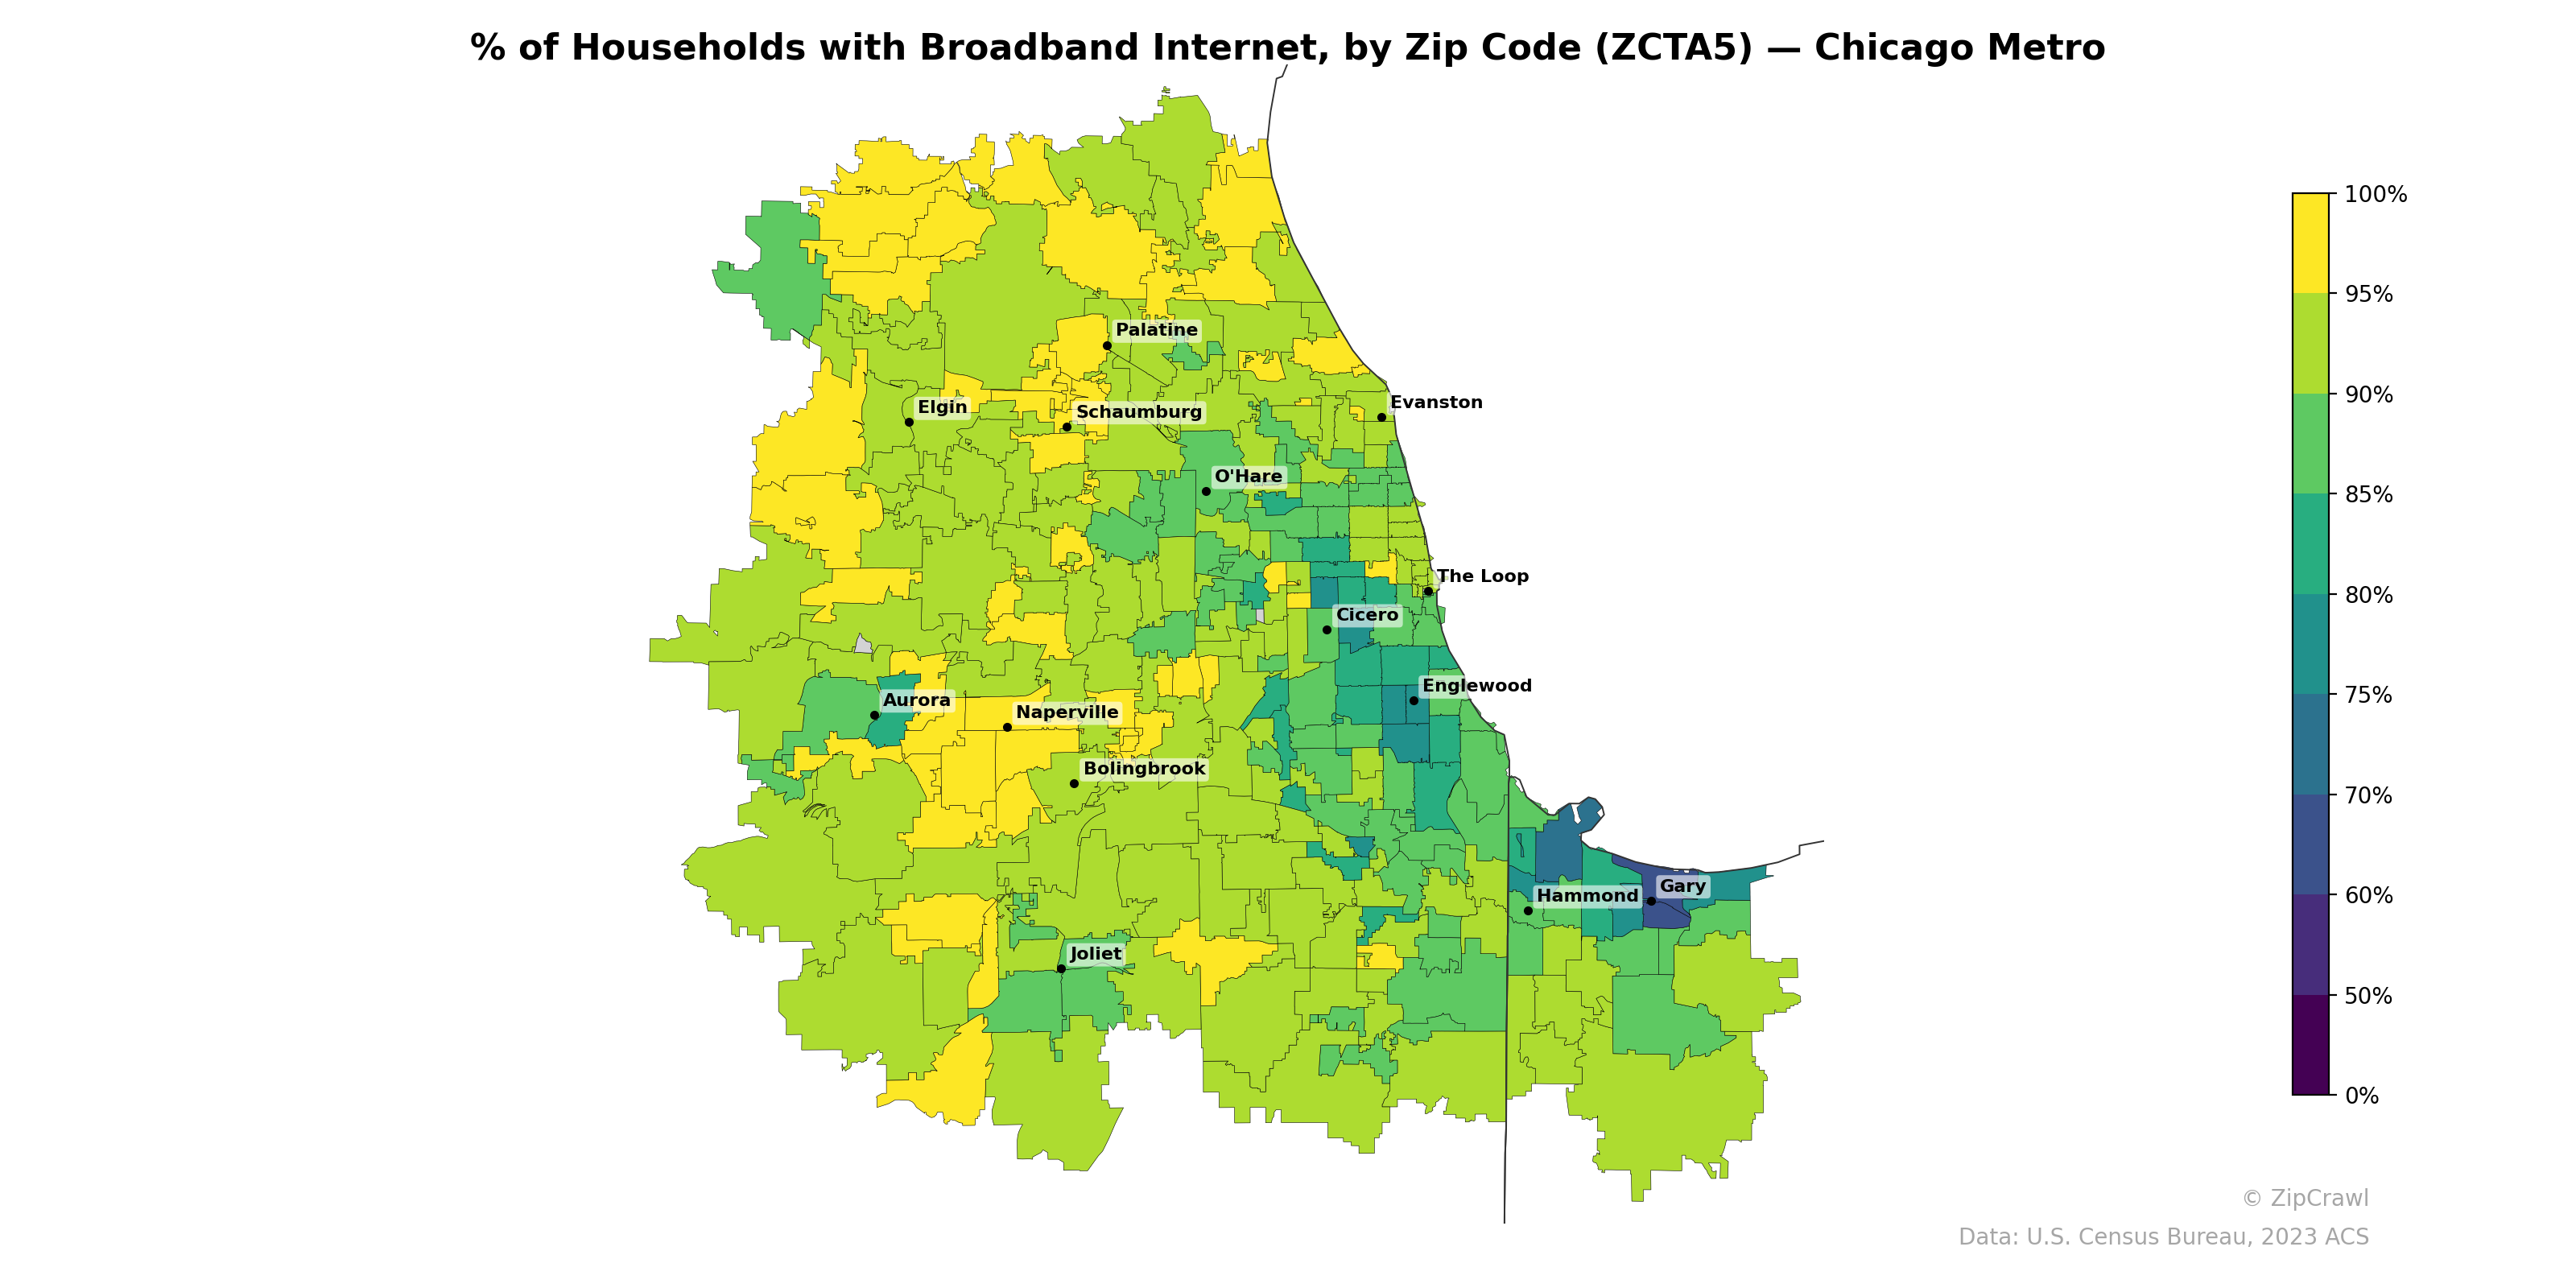
NOTE: Gray indicates insufficient data or a suppressed estimate.
Broadband internet adoption rates across the Chicago metro area reveal a stark urban-suburban divide, with the highest penetration (90–100%) concentrated in the western and northwestern suburbs such as Naperville, Schaumburg, and Palatine, while the south side of Chicago—particularly around Englewood—and the Gary/Hammond corridor in northwest Indiana fall notably below 70%. A cluster of lower-connectivity zip codes also appears along Chicago's west side near Cicero, contrasting sharply with the affluent North Shore communities near Evanston that maintain rates above 85%. The southern exurban fringe around Joliet and areas south of Bolingbrook show moderate-to-high adoption in the 80–90% range, suggesting that income and infrastructure investment rather than simple urban density are the primary drivers of the digital divide in this metro.
Data: U.S. Census Bureau, 2023 ACS
Explore
- Household Average Size by Zip Code (ZCTA5) — Tampa Metro
- Bachelor's Degree or Higher (% of Over 25) by Zip Code (ZCTA5) — Tampa Metro
- Housing % of Units Built Since 2010, by Zip Code (ZCTA5) — Tampa Metro
- Housing Owner-Occupied % of Units, by Zip Code (ZCTA5) — Tampa Metro
- Housing Vacancy Rate by Zip Code (ZCTA5) — Tampa Metro
- Married Couple (% of all Households) by Zip Code (ZCTA5) — Tampa Metro
- % of Population without Health Insurance, by Zip Code (ZCTA5) — Tampa Metro
- Housing Owner-Occupied Median Value ($), by Zip Code (ZCTA5) — Tampa Metro
- Housing Median Monthly Rent ($), by Zip Code (ZCTA5) — Tampa Metro
- Population Non-Hispanic American Indian % by County
- Housing Vacancy Rate by Zip Code (ZCTA5) — Chicago Metro
- Housing Median Monthly Rent ($), by Zip Code (ZCTA5) — Chicago Metro
- Married Couple (% of all Households) by Zip Code (ZCTA5) — Chicago Metro
- Housing Owner-Occupied Median Value ($), by Zip Code (ZCTA5) — Chicago Metro
- Household Average Size by Zip Code (ZCTA5) — Chicago Metro
- Bachelor's Degree or Higher (% of Over 25) by Zip Code (ZCTA5) — Chicago Metro
- Housing % of Units Built Since 2010, by Zip Code (ZCTA5) — Chicago Metro
- % of Population without Health Insurance, by Zip Code (ZCTA5) — Chicago Metro
- Housing Owner-Occupied % of Units, by Zip Code (ZCTA5) — Chicago Metro
- Household Average Size by Zip Code (ZCTA5) — Denver Metro
- Housing Owner-Occupied Median Value ($), by Zip Code (ZCTA5) — Denver Metro
- Married Couple (% of all Households) by Zip Code (ZCTA5) — Denver Metro
- Population Non-Hispanic American Indian % by Zip Code (ZCTA5) — Denver Metro
- Bachelor's Degree or Higher (% of Over 25) by Zip Code (ZCTA5) — Denver Metro
- Population Hispanic % by Zip Code (ZCTA5) — Denver Metro
- High School Graduate (% of Over 25) by Zip Code (ZCTA5) — Denver Metro
- Population Non-Hispanic White % by Zip Code (ZCTA5) — Denver Metro
- Housing Owner-Occupied % of Units, by Zip Code (ZCTA5) — Denver Metro
- Housing % of Units Built Since 2010, by Zip Code (ZCTA5) — Denver Metro
- Population Non-Hispanic Black % by Zip Code (ZCTA5) — Denver Metro
- % of Households with Broadband Internet, by Zip Code (ZCTA5) — Houston Metro
- % of Households with Broadband Internet, by Zip Code (ZCTA5) — Miami Metro
- % of Households with Broadband Internet, by Zip Code (ZCTA5) — Tampa Metro
- % of Households with Broadband Internet, by Zip Code (ZCTA5) — Orlando Metro
- % of Households with Broadband Internet, by Zip Code (ZCTA5) — Detroit Metro
- % of Households with Broadband Internet, by Zip Code (ZCTA5) — Boston Metro
- % of Households with Broadband Internet, by Zip Code (ZCTA5) — Charlotte Metro
- % of Households with Broadband Internet, by Zip Code (ZCTA5) — Dallas Metro
- % of Households with Broadband Internet, by Zip Code (ZCTA5) — Denver Metro
- % of Households with Broadband Internet, by Zip Code (ZCTA5) — Austin Metro