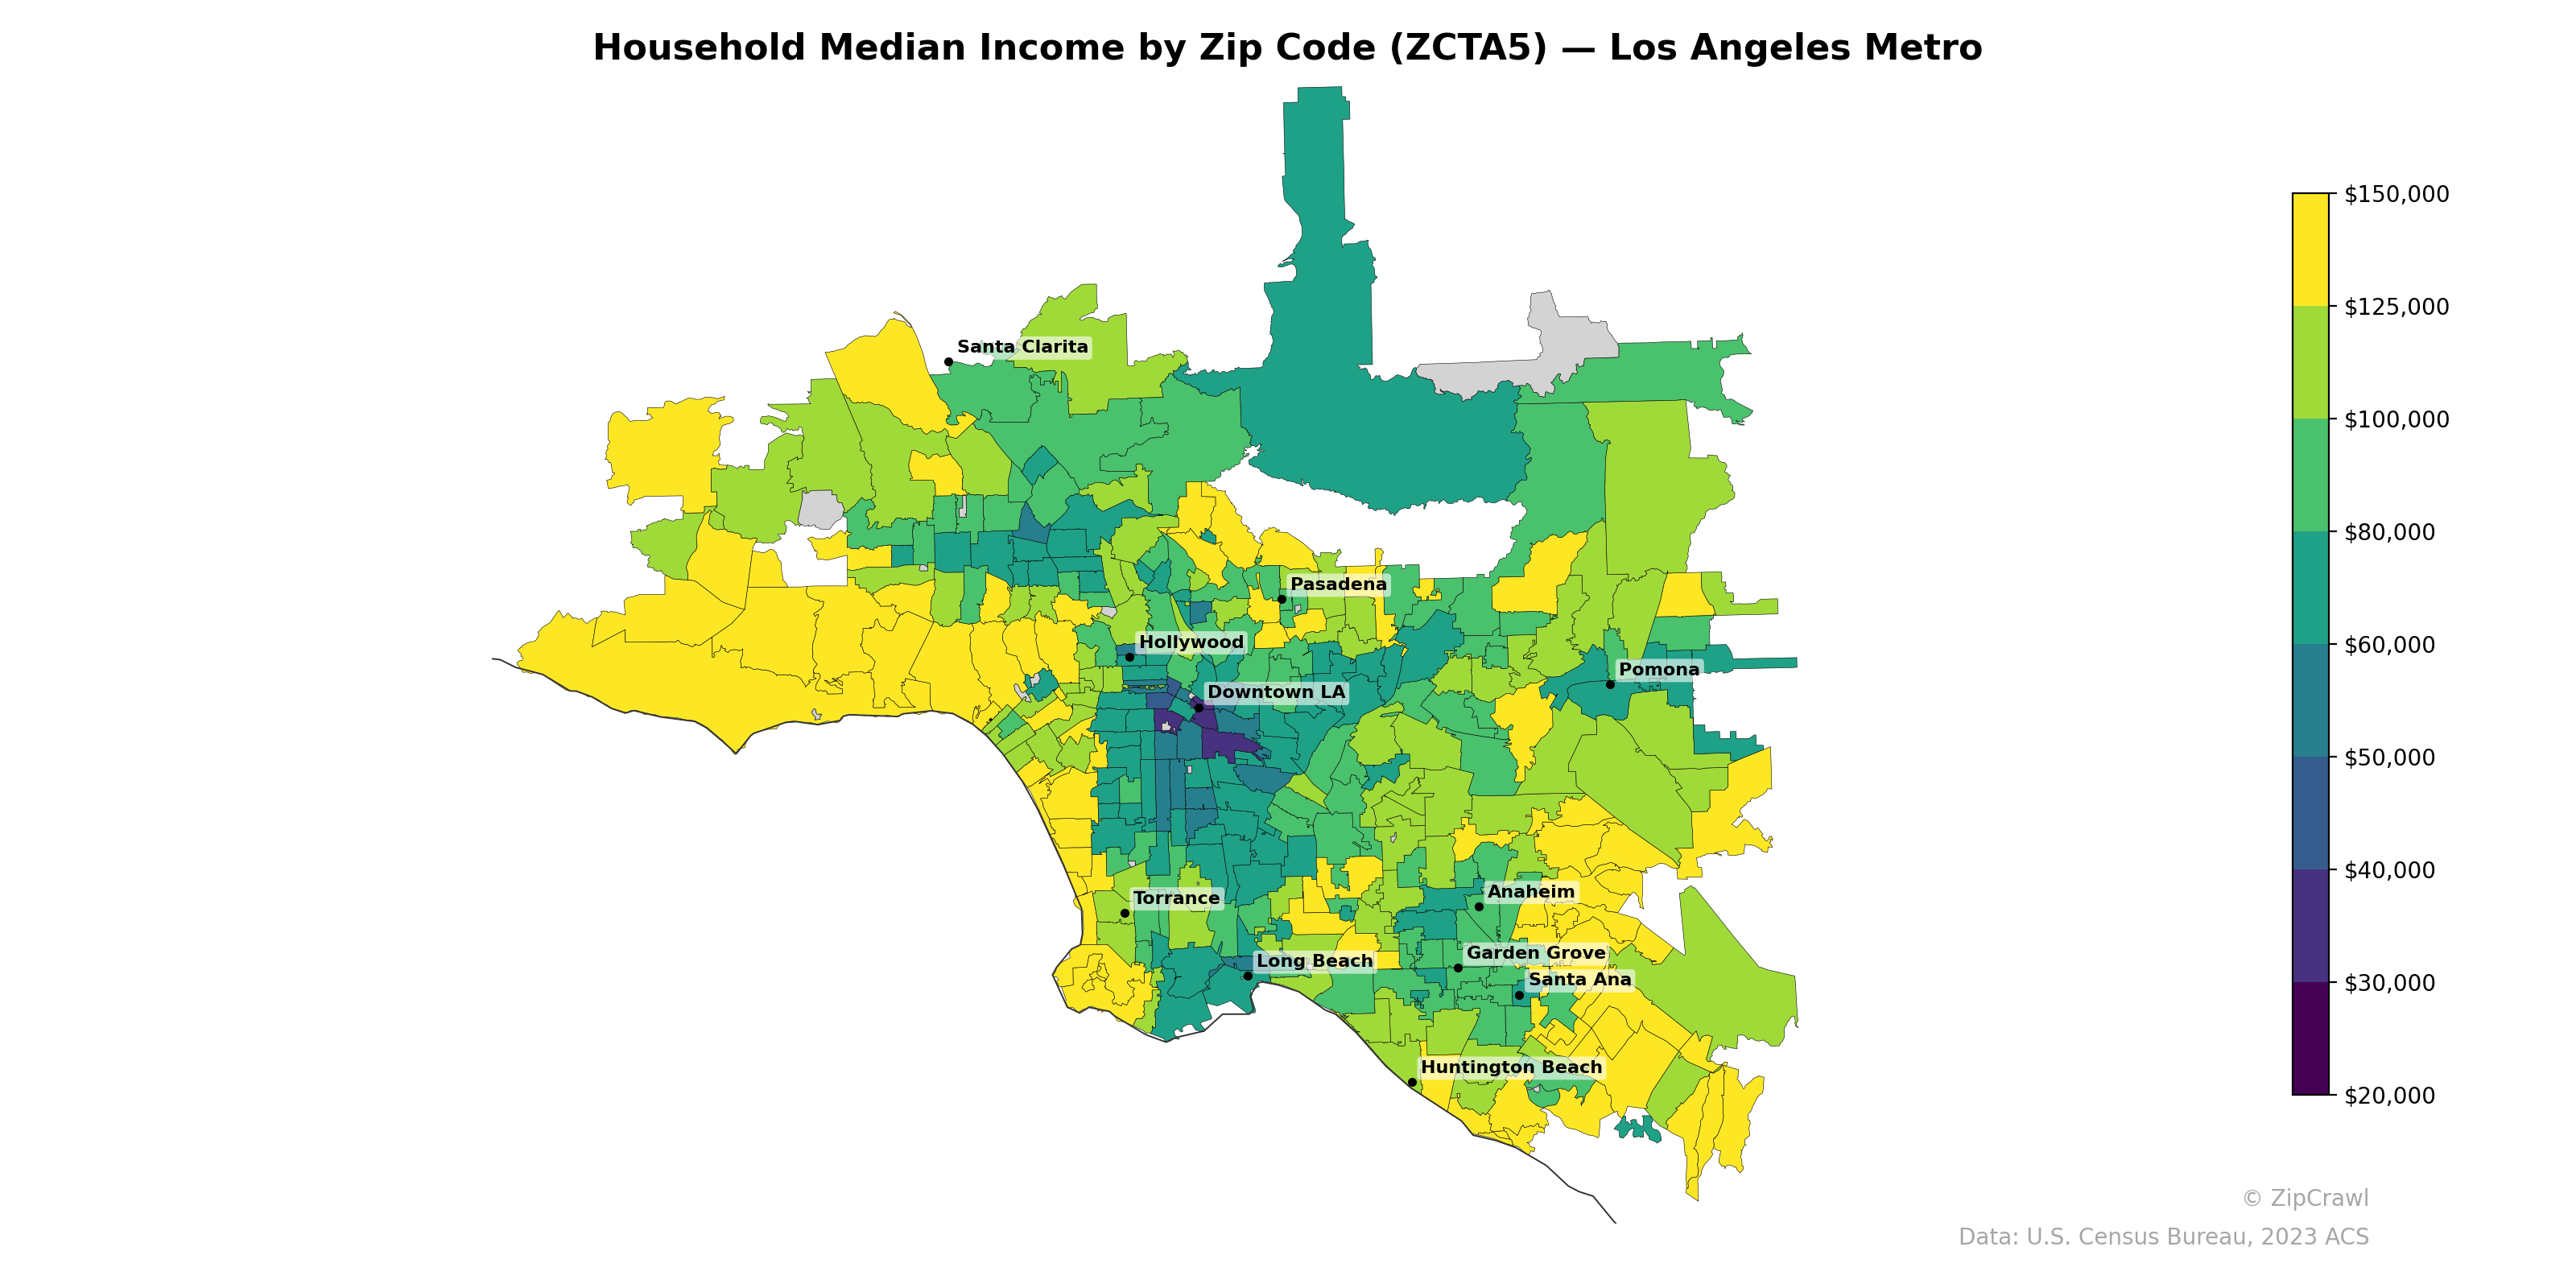
NOTE: Gray indicates insufficient data or a suppressed estimate.
Affluent zip codes with household median incomes exceeding $125,000 concentrate along the western coastal corridor from the Westside through to the Palos Verdes Peninsula, as well as in foothill communities stretching from La Cañada Flintridge through the San Gabriel Valley's northern edge and into the Santa Clarita Valley. A pronounced low-income band with medians below $50,000 runs through South Los Angeles, central Long Beach, and parts of central Orange County including Santa Ana, contrasting sharply with adjacent high-income areas in coastal Orange County and the Irvine plateau. The eastern San Gabriel Valley and Inland Empire fringe areas display moderate incomes in the $60,000–$80,000 range, forming a transitional zone between the metro's wealthiest and most economically disadvantaged communities.
Data: U.S. Census Bureau, 2023 ACS
Explore
- Married Couple (% of all Households) by Zip Code (ZCTA5) — Phoenix Metro
- Housing % of Units Built Since 2010, by Zip Code (ZCTA5) — Phoenix Metro
- Bachelor's Degree or Higher (% of Over 25) by Zip Code (ZCTA5) — Phoenix Metro
- Household Average Size by Zip Code (ZCTA5) — Phoenix Metro
- Housing Owner-Occupied Median Value ($), by Zip Code (ZCTA5) — Phoenix Metro
- % of Population without Health Insurance, by Zip Code (ZCTA5) — Phoenix Metro
- % of Households with Broadband Internet, by Zip Code (ZCTA5) — Phoenix Metro
- Housing Median Monthly Rent ($), by Zip Code (ZCTA5) — Phoenix Metro
- Housing Owner-Occupied % of Units, by Zip Code (ZCTA5) — Phoenix Metro
- Housing Vacancy Rate by Zip Code (ZCTA5) — Phoenix Metro
- Population Hispanic % by County
- High School Graduate (% of Over 25) by Zip Code (ZCTA5) — Los Angeles Metro
- Population Non-Hispanic American Indian % by Zip Code (ZCTA5) — Los Angeles Metro
- Population Non-Hispanic White % by Zip Code (ZCTA5) — Los Angeles Metro
- Population Non-Hispanic Black % by Zip Code (ZCTA5) — Los Angeles Metro
- U.S. Citizens (% of Population Over 18) by Zip Code (ZCTA5) — Los Angeles Metro
- % of Population on Food Stamps or SNAP (Last 12 Months), by Zip Code (ZCTA5) — New York Metro
- Median Age by Zip Code (ZCTA5) — Los Angeles Metro
- Population Hispanic % by Zip Code (ZCTA5) — Los Angeles Metro
- Housing Vacancy Rate by Zip Code (ZCTA5) — Virginia
- Household Average Size by Zip Code (ZCTA5) — Virginia
- Population Non-Hispanic Asian % by Zip Code (ZCTA5) — Virginia
- % of Households with Broadband Internet, by Zip Code (ZCTA5) — Virginia
- Housing Owner-Occupied % of Units, by Zip Code (ZCTA5) — Virginia
- High School Graduate (% of Over 25) by Zip Code (ZCTA5) — Virginia
- % of Population without Health Insurance, by Zip Code (ZCTA5) — Virginia
- Housing Median Monthly Rent ($), by Zip Code (ZCTA5) — Virginia
- Housing % of Units Built Since 2010, by Zip Code (ZCTA5) — Virginia
- Married Couple (% of all Households) by Zip Code (ZCTA5) — Virginia
- Bachelor's Degree or Higher (% of Over 25) by Zip Code (ZCTA5) — Virginia
- Household Median Income by Zip Code (ZCTA5) — Houston Metro
- Household Median Income by Zip Code (ZCTA5) — St. Louis Metro
- Household Median Income by Zip Code (ZCTA5) — Austin Metro
- Household Median Income by Zip Code (ZCTA5) — Miami Metro
- Household Median Income by Zip Code (ZCTA5) — Atlanta Metro
- Household Median Income by Zip Code (ZCTA5) — Tampa Metro
- Household Median Income by Zip Code (ZCTA5) — Boston Metro
- Household Median Income by Zip Code (ZCTA5) — Detroit Metro
- Household Median Income by Zip Code (ZCTA5) — San Antonio Metro
- Household Median Income by Zip Code (ZCTA5) — Chicago Metro