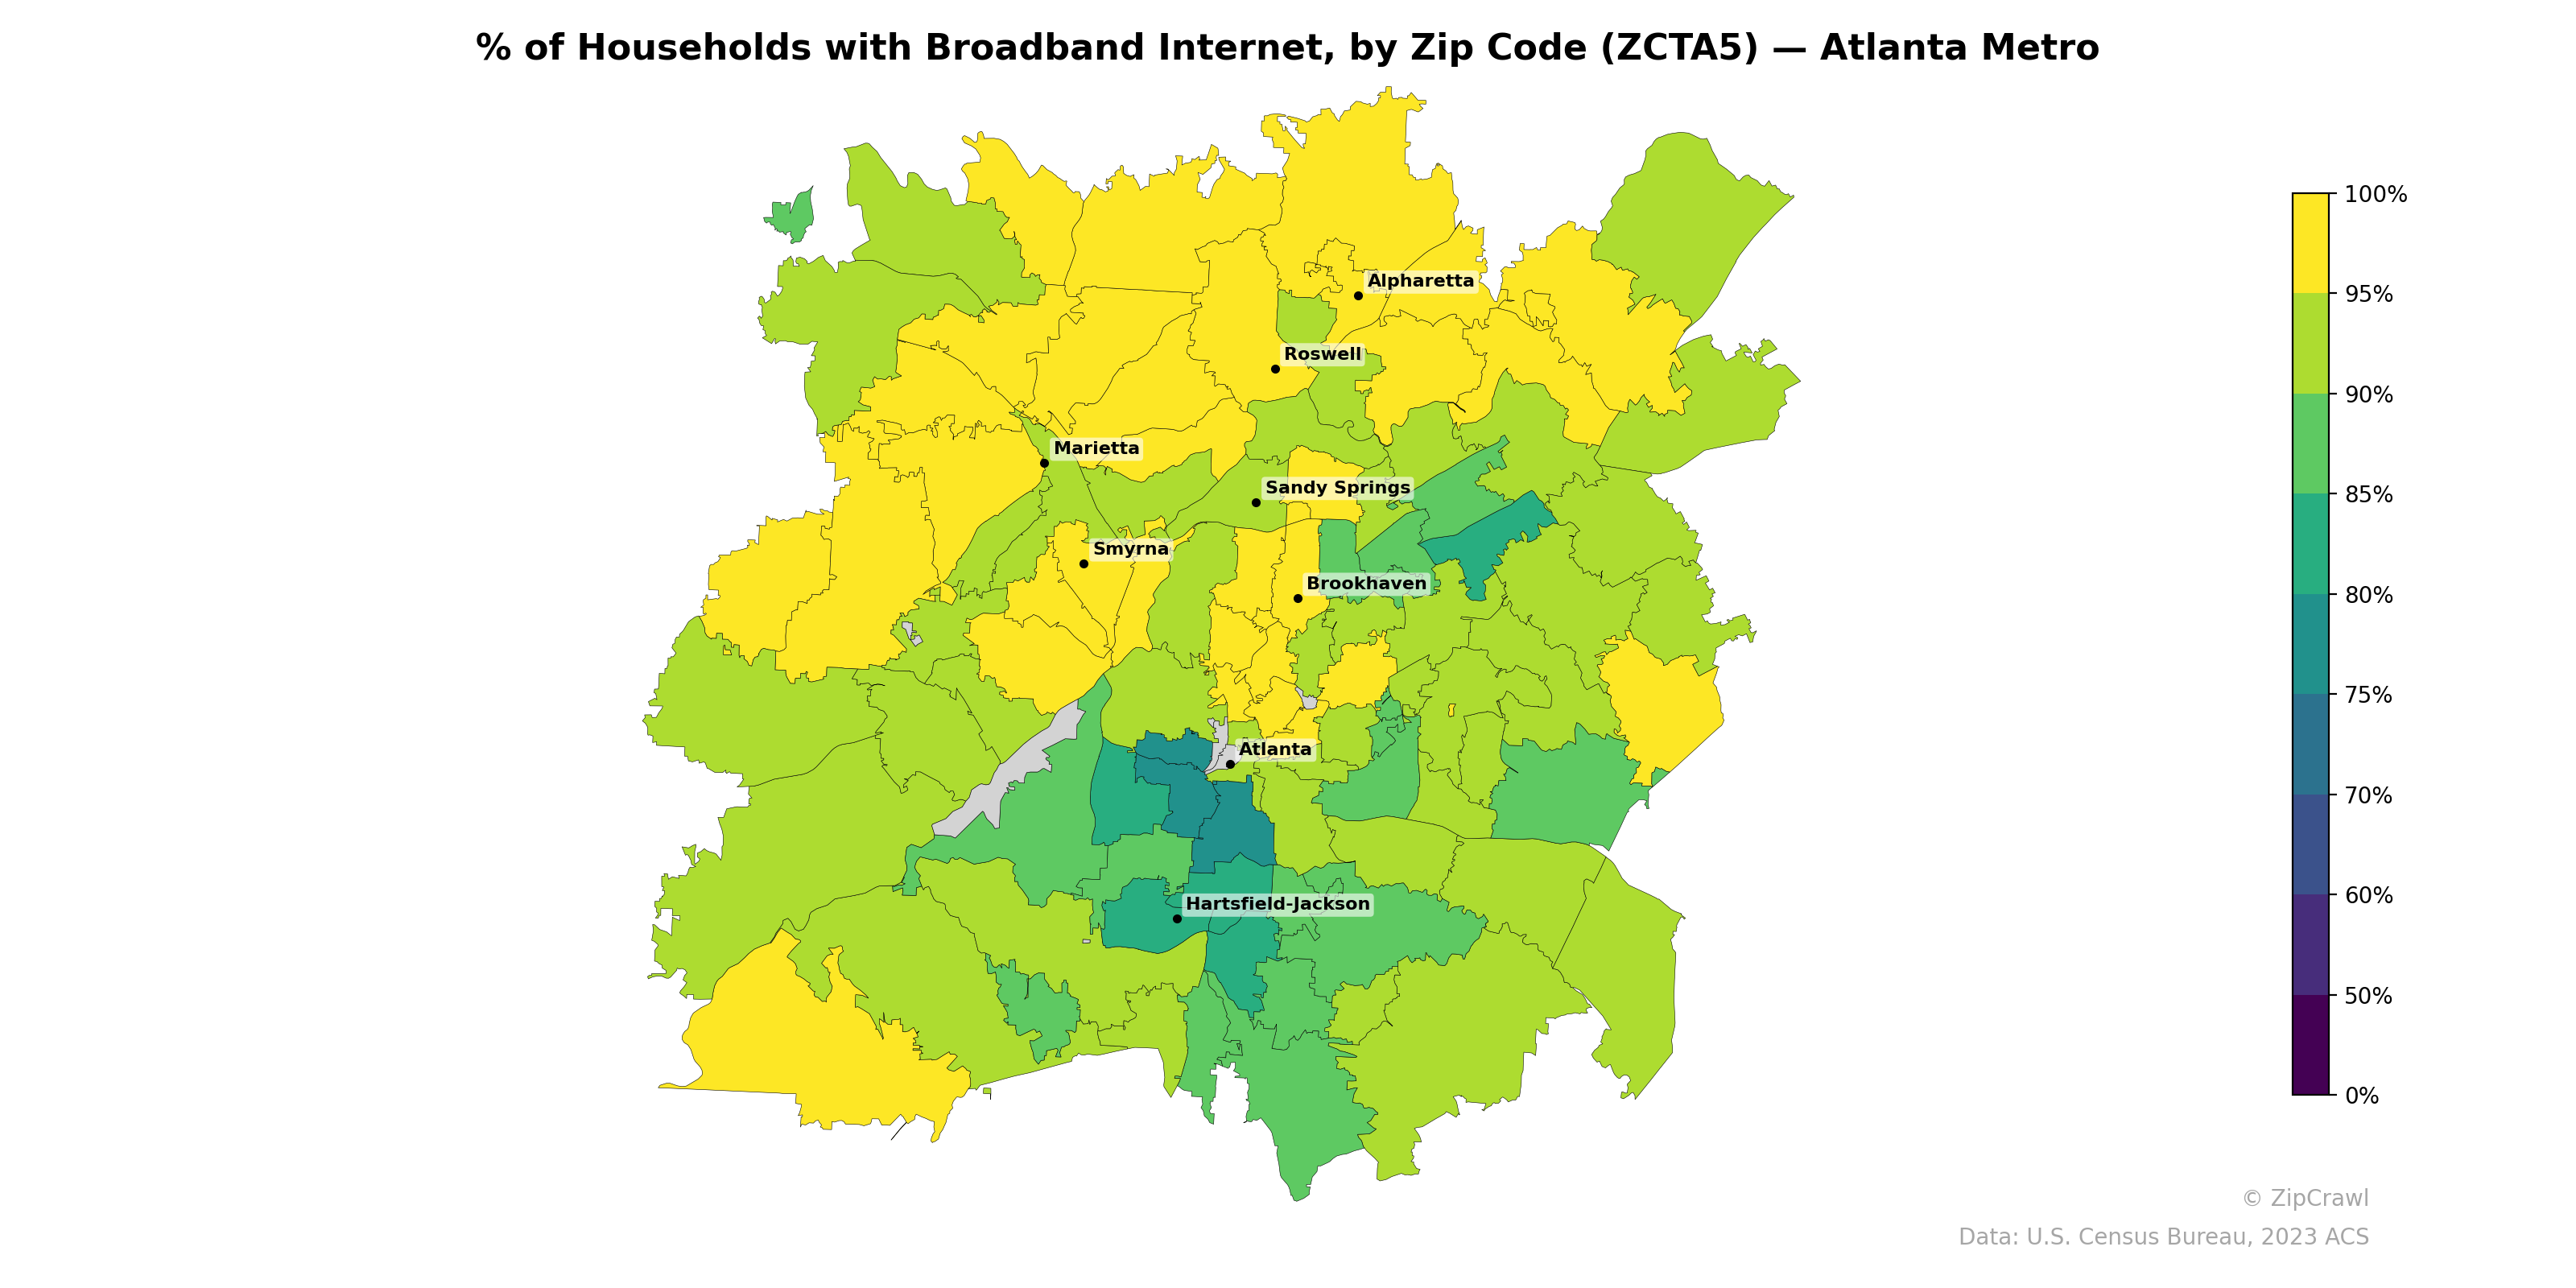
NOTE: Gray indicates insufficient data or a suppressed estimate.
Broadband adoption rates in the Atlanta metro exhibit a clear north-south divide, with zip codes north of I-20—particularly in Alpharetta, Roswell, Sandy Springs, and Marietta—consistently exceeding 90%, while areas south of Hartsfield-Jackson and in south Atlanta dip below 60%, representing some of the lowest connectivity rates in the region. A concentrated cluster of low-broadband zip codes is visible immediately south of downtown Atlanta, extending toward and beyond the airport, contrasting sharply with the uniformly high-access suburban ring to the north and northwest. The eastern and southeastern periphery of the metro also shows moderate adoption gaps in the 70–80% range, suggesting that the digital divide follows both income geography and distance from the affluent northern suburbs.
Data: U.S. Census Bureau, 2023 ACS
Explore
- Population Non-Hispanic Asian % by Zip Code (ZCTA5) — New York Metro
- Married Couple (% of all Households) by Zip Code (ZCTA5) — Atlanta Metro
- % of Population without Health Insurance, by Zip Code (ZCTA5) — Atlanta Metro
- Housing Owner-Occupied Median Value ($), by Zip Code (ZCTA5) — Atlanta Metro
- Bachelor's Degree or Higher (% of Over 25) by Zip Code (ZCTA5) — Atlanta Metro
- Housing Owner-Occupied % of Units, by Zip Code (ZCTA5) — Atlanta Metro
- Housing Vacancy Rate by Zip Code (ZCTA5) — Atlanta Metro
- Household Average Size by Zip Code (ZCTA5) — Atlanta Metro
- Housing % of Units Built Since 2010, by Zip Code (ZCTA5) — Atlanta Metro
- Housing Median Monthly Rent ($), by Zip Code (ZCTA5) — Atlanta Metro
- Housing Vacancy Rate by Zip Code (ZCTA5) — Idaho
- Population Non-Hispanic White % by County
- % of Population without Health Insurance, by Zip Code (ZCTA5) — New York Metro
- Married Couple (% of all Households) by Zip Code (ZCTA5) — New York Metro
- Housing % of Units Built Since 2010, by Zip Code (ZCTA5) — New York Metro
- Housing Owner-Occupied Median Value ($), by Zip Code (ZCTA5) — New York Metro
- Housing Median Monthly Rent ($), by Zip Code (ZCTA5) — New York Metro
- Household Average Size by Zip Code (ZCTA5) — New York Metro
- Housing Vacancy Rate by Zip Code (ZCTA5) — New York Metro
- Population Non-Hispanic Asian % by Zip Code (ZCTA5) — North Carolina
- Married Couple (% of all Households) by Zip Code (ZCTA5) — North Carolina
- % of Population on Food Stamps or SNAP (Last 12 Months), by Zip Code (ZCTA5) — North Carolina
- % of Population without Health Insurance, by Zip Code (ZCTA5) — North Carolina
- Housing Owner-Occupied Median Value ($), by Zip Code (ZCTA5) — North Carolina
- High School Graduate (% of Over 25) by Zip Code (ZCTA5) — North Carolina
- Housing Owner-Occupied % of Units, by Zip Code (ZCTA5) — North Carolina
- Housing % of Units Built Since 2010, by Zip Code (ZCTA5) — North Carolina
- Household Average Size by Zip Code (ZCTA5) — North Carolina
- Housing Vacancy Rate by Zip Code (ZCTA5) — North Carolina
- Bachelor's Degree or Higher (% of Over 25) by Zip Code (ZCTA5) — North Carolina
- % of Households with Broadband Internet, by Zip Code (ZCTA5) — Portland Metro
- % of Households with Broadband Internet, by Zip Code (ZCTA5) — Orlando Metro
- % of Households with Broadband Internet, by Zip Code (ZCTA5) — Houston Metro
- % of Households with Broadband Internet, by Zip Code (ZCTA5) — Austin Metro
- % of Households with Broadband Internet, by Zip Code (ZCTA5) — Miami Metro
- % of Households with Broadband Internet, by Zip Code (ZCTA5) — Detroit Metro
- % of Households with Broadband Internet, by Zip Code (ZCTA5) — Tampa Metro
- % of Households with Broadband Internet, by Zip Code (ZCTA5) — Boston Metro
- % of Households with Broadband Internet, by Zip Code (ZCTA5) — Chicago Metro
- % of Households with Broadband Internet, by Zip Code (ZCTA5) — Dallas Metro